> For the complete documentation index, see [llms.txt](https://docs.drivepoint.io/llms.txt). Markdown versions of documentation pages are available by appending `.md` to page URLs; this page is available as [Markdown](https://docs.drivepoint.io/using-the-web-app/dashboards/financial-heartbeat.md).
# Financial Heartbeat
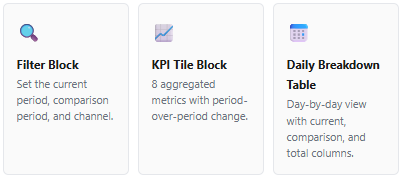
An overview of the report's three main blocks and how they work together.
## Filter Block
Three filters that control the scope of the entire report.
1. ### Current Period
A dynamic date filter that defines the window you want to analyze. The default is **this month to today** — for example, all days in March up to today's date.
Available range options include:
| Option | Description |
| -------------------------------------- | --------------------------------------------------------------- |
| `This month / today` | All days from the 1st of the current month through today |
| `Yesterday` | The previous full day |
| `In the past…` | Rolling window: past N days, weeks, quarters, hours, or minutes |
| `Hours / Weekdays / Months / Quarters` | Granularity options for intra-period views |
| `Custom` | Manually define a start and end date |
2. ### Compare Period
Defines the reference window used for benchmarking. The default is **previous month** (same date range, one month prior). Options include:
| Option | Example use case |
| -------------------------------- | ------------------------------------------------ |
| `Previous month` | Compare March performance against February |
| `Previous week` | Compare the past 7 days against the prior 7 days |
| `Previous year` | Year-over-year comparison for the same period |
| `Previous week of previous year` | Combine both for cross-year weekly benchmarking |
3. ### Channel
Filter data by sales channel. All three are selected by default:
| Channel | Description |
| --------------- | --------------------------------------- |
| **Amazon** | Amazon marketplace |
| **DTC** | Direct-to-consumer storefront (Shopify) |
| **TikTok Shop** | TikTok social commerce |
## KPI Tile Block
Eight metric tiles showing aggregated values for the current period with a % change indicator versus the comparison period.
### Reading a KPI tile
Each tile shows the total value for the selected period. Below it, a colored indicator reflects performance versus the comparison period:
| Indicator | Meaning |
| ---------- | ------------------------------------------------------- |
| 🟢 Green % | Current period is **higher** than the comparison period |
| 🔴 Red % | Current period is **lower** than the comparison period |
1. ### Transactional metrics Tiles 1–4
Sourced from the **transactional data source**.
| KPI | Definition |
| ----------------------- | ---------------------------------------- |
| **Net Revenue** | Total net revenue for the current period |
| **Orders** | Total number of orders placed |
| **Average Order Value** | `Net Revenue ÷ Orders` |
| **Gross Profit** | Revenue minus cost of goods sold |
2. ### Marketing metrics Tiles 5–8
Sourced from the **Smart Model Source**.
| KPI | Definition |
| ----------------------- | ------------------------------------- |
| **Direct Advertising** | Total direct ad spend for the period |
| **ROAS** | `Net Revenue ÷ Direct Advertising` |
| **Marketing Expenses** | Total marketing costs for the period |
| **Contribution Profit** | Gross Profit minus marketing expenses |
## Cross-Channel Daily Breakdown Table
A day-by-day view of performance for the current and comparison periods, with static totals on the right.
### Column groups
| Group | Columns | Notes |
| --------------------- | ----------------------------------------------------- | ------------------------------------------------------ |
| **Current Period** | Net Revenue, Orders, AOV, Gross Profit, % Net Revenue | Reflects the selected current period |
| **Comparison Period** | Net Revenue, Orders, AOV, Gross Profit, % Net Revenue | Reflects the selected comparison period |
| **Total** | Net Revenue, Orders, AOV, Gross Profit, % Net Revenue | Row-level totals — static, always visible on the right |
---
# Agent Instructions
This documentation is published with GitBook. GitBook is the documentation platform designed so that both humans and AI agents can read, navigate, and reason over technical content effectively. Learn more at gitbook.com.
## Querying This Documentation
If you need additional information that is not directly available in this page, you can query the documentation by asking a question.
Perform an HTTP GET request on the following URL with the `ask` and `goal` query parameters:
```
GET https://docs.drivepoint.io/using-the-web-app/dashboards/financial-heartbeat.md?ask=&goal=
```
`ask` is the immediate question: it should be specific, self-contained, and written in natural language.
`goal` is what the user is ultimately trying to achieve, the reason they need the answer. Sharing it helps GitBook give you a better, more relevant answer. A goal is most helpful when it describes the outcome the user wants rather than restating the question. For example, with `ask=how do I create an API token`, a goal like `automate deployments from our CI pipeline` lets GitBook tailor the answer to that use case.
The response will contain a direct answer to the question and relevant excerpts and sources from the documentation.
Use this mechanism when the answer is not explicitly present in the current page, you need clarification or additional context, or you want to retrieve related documentation sections.