# Knowledge Hub

Click on any of the links below to find support articles. Alternatively, use the search bar on the top right to get to articles directly.

<table data-view="cards"><thead><tr><th></th><th></th><th></th><th data-hidden data-card-target data-type="content-ref"></th><th data-hidden data-card-cover data-type="files"></th></tr></thead><tbody><tr><td></td><td></td><td><p></p><p>🚀 <strong>Getting Started</strong></p></td><td><a href="https://docs.drivepoint.io/getting-started/">Getting Started</a></td><td><a href="https://2039655949-files.gitbook.io/~/files/v0/b/gitbook-x-prod.appspot.com/o/spaces%2FRf4NATRxrCRvV0zJg0DS%2Fuploads%2F6OCjfUqCiB3evQrtcjLJ%2FScenario%20Analysis.png?alt=media&amp;token=88b4d184-9cab-4c21-af4c-9937f87e1fe6">Scenario Analysis.png</a></td></tr><tr><td></td><td></td><td><p></p><p>🔌 <strong>Data Integrations</strong></p></td><td><a href="https://docs.drivepoint.io/data-integrations/">Data Integrations</a></td><td><a href="https://2039655949-files.gitbook.io/~/files/v0/b/gitbook-x-prod.appspot.com/o/spaces%2FRf4NATRxrCRvV0zJg0DS%2Fuploads%2FLyyXxI1873c9IvuGYUtP%2FKPI%20Scorecards%20(1).png?alt=media&amp;token=f667c44f-67e6-4464-a64b-f057780eb100">KPI Scorecards (1).png</a></td></tr><tr><td></td><td></td><td>📈 <strong>Working in the SmartModel™️</strong></td><td><a href="https://docs.drivepoint.io/working-in-the-smartmodel-tm/">Working in the SmartModel™️</a></td><td><a href="https://2039655949-files.gitbook.io/~/files/v0/b/gitbook-x-prod.appspot.com/o/spaces%2FRf4NATRxrCRvV0zJg0DS%2Fuploads%2FgOC5xp11bjx8E40cf13Y%2FSmartModel.png?alt=media&amp;token=a1a5cb13-d90b-4b55-943c-51d2cb2cbebd">SmartModel.png</a></td></tr><tr><td></td><td></td><td><strong>🖱️Navigating the Excel Add-In</strong></td><td><a href="https://docs.drivepoint.io/navigating-the-excel-add-in/">Navigating the Excel Add-In</a></td><td><a href="https://2039655949-files.gitbook.io/~/files/v0/b/gitbook-x-prod.appspot.com/o/spaces%2FRf4NATRxrCRvV0zJg0DS%2Fuploads%2FucXleFB8ncZUsmHDLED0%2FPredictive%20Retention%20Models.png?alt=media&amp;token=c360021e-ea0c-483f-8ef1-7c0eca041ea0">Predictive Retention Models.png</a></td></tr><tr><td></td><td></td><td>🖥️ <strong>Using the Web-App</strong></td><td><a href="https://docs.drivepoint.io/using-the-web-app/">Using the Web-App</a></td><td><a href="https://2039655949-files.gitbook.io/~/files/v0/b/gitbook-x-prod.appspot.com/o/spaces%2FRf4NATRxrCRvV0zJg0DS%2Fuploads%2FQxuQdSeI34xilTVMJh0q%2FCustom%20Dashboards%20(1).png?alt=media&amp;token=443eb46c-4c2a-4ac6-9bc8-ef30615f33f7">Custom Dashboards (1).png</a></td></tr><tr><td></td><td></td><td>❓ <strong>FAQ</strong></td><td><a href="https://docs.drivepoint.io/faq/">FAQ</a></td><td><a href="https://2039655949-files.gitbook.io/~/files/v0/b/gitbook-x-prod.appspot.com/o/spaces%2FRf4NATRxrCRvV0zJg0DS%2Fuploads%2F0g392UITmrOBNqgzUkgD%2FFinancial%20Forecasting.png?alt=media&amp;token=f1c54fb6-4a71-43d8-b9a4-9d28df55c158">Financial Forecasting.png</a></td></tr><tr><td></td><td></td><td><strong>💬 Help</strong></td><td><a href="https://docs.drivepoint.io/help-1/">Help</a></td><td><a href="https://2039655949-files.gitbook.io/~/files/v0/b/gitbook-x-prod.appspot.com/o/spaces%2FRf4NATRxrCRvV0zJg0DS%2Fuploads%2FkVSqIzo722qIfbu2XGYT%2FOn-Demand%20Analysts.png?alt=media&amp;token=2e73ed2d-2f62-440b-b5d2-22a50480b2c4">On-Demand Analysts.png</a></td></tr></tbody></table>

##


# Logging into your account

This is the first step to navigate around the web-app.

Your Drivepoint account is easiest to access through the Drivepoint web application.

1. Navigate to the Drivepoint web app by clicking [this](https://app.drivepoint.io/) link. *(💡Bookmark this tab for easy access to the web-app and the redirect to SmartModel™️)*
2. You can select logging in through Gmail or manual email input
3. Once logged in, click on the SmartModel™️ button on the left side bar
4. You may need to log into your Microsoft 365 account as well

More details on in the video below.

{% embed url="<https://www.loom.com/share/43195831c760464eb307099e596b0d82?sid=5ef60cd5-f8f0-496a-a1b5-e2524b2522ee>" %}


# Connecting your first data source

I want to see Drivepoint in action! What can I do after logging in?

**Step 1:** Navigate to the [Drivepoint platform](https://app.drivepoint.io/)

**Step 2:** Click on "Data Sources" on the left sidebar

**Step 3:** Click on the "Connect" button on the top right of the page

**Step 4:** Choose your preferred datasource *(💡Most of our clients start with Shopify or Quickbooks)*

{% hint style="info" %}
Unsure which permissions you need for Shopify if you are not the Store Owner? Check out our Shopify Integration guide [here](/data-integrations/shopify).&#x20;
{% endhint %}

**Step 5:** Follow the instructions in the pop-up video

**Step 6:** Once you see the green success bar on top of the main data source page -> congrats 🎉- you connected your first data source!

**Step 7:** Connect more data sources *(💡at least one operational source: Shopify and/or Amazon and one financial source: Quickbooks or Netsuite)*

**Step 8:** Email your Drivepoint rep and relax - you have done all of the work. Now it is our turn! We will be in touch.&#x20;


# Installing the Drivepoint Add-In

💡Simply search for "Drivepoint" in the Microsoft Web Store

**Step 1:** Open your Drivepoint SmartModel™️ (by clicking on SmartModel™️ on the left side menu [here](https://app.drivepoint.io/))

**Step 2:** Using the Excel Toolbar, click on the **Insert** tab and select the **Get Add-Ins** option

**Step 3:** In the dialog that appears, select the **Store** tab in the top left of the screen

**Step 4:** Use the search bar in the left hand navigation area to search for "Drivepoint"

**Step 5:** Click on the Bainbridge Add-In and select **Get Add-In**

**Step 6:** Once the Add-In is open, follow the steps to login in to your Drivepoint account using the same email and password you use to log into your main Drivepoint homepage


# Quickstart FAQ

You connected your data sources - now what?

### For CEOs,

<details>

<summary>What’s my LTV, and how is it trending by channel?</summary>

Drivepoint automatically creates multiple kinds of LTV metrics.&#x20;

1. Navigate to [Reports](https://app.drivepoint.io/)
2. Click on "DTC" or "Amazon Cohort Analysis"
3. Open the first report (Cohorted Financials)
4. Toggle between Gross/Net Sales LTV and Contribution Profit LTV after Marketing

If you have questions about how certain metrics are calculated. Click on the 💡 in the report that will link to our [documentation](https://docs.drivepoint.io/help/using-the-web-app/reports/cohort-analysis).

</details>

<details>

<summary>Where can I see if we're actually profitable by cohort?</summary>

1. Open the Cohorted Financials report (see one question above of how to navigate there)
2. Toggle the metric to "Contribution Profit Less Blended CAC"&#x20;

*In order to get to change the metric. Click the Customize button on the top right of the report.*&#x20;

<figure><img src="https://1756028981-files.gitbook.io/~/files/v0/b/gitbook-x-prod.appspot.com/o/spaces%2FrjmuDgysAFZevCjf2H6g%2Fuploads%2FGJmIpq3pPzkCZaRHNBO1%2Fimage.png?alt=media&amp;token=046e4147-c480-493a-8e79-a6feb20c688a" alt=""><figcaption></figcaption></figure>

</details>

<details>

<summary>How do I quickly understand what’s driving our EBITDA?</summary>

If you have a full Financial Model built out in Drivepoint, navigate to Variance Reviews and then the P\&L Variance Report to understand line by line where you missed.&#x20;

If you are not fully set up as a customer in Drivepoint, a good place to start is the P\&L Benchmarks report to see how your drivers performance compare to your peers.&#x20;

1. Click on [Reports](https://app.drivepoint.io/)
2. Click on "Benchmarks"
3. Click on P\&L "Benchmarks"
4. Hover over the table to view your score compared to the quartiles and median

</details>

<details>

<summary>Can you show me a few scenarios if we increase spend or expand wholesale?</summary>

Creating scenarios is easy in [Drivepoint](https://app.drivepoint.io/):&#x20;

1. Click on "Plans"
2. Click on "Quick Edit" on the top right of your live model
3. Select a wholesale driver in the drop-down
4. Change the driver by editing the values in the table directly or set it to a specific value via the drop-down
5. Click on "Preview"
6. View the impact of a specific wholesale driver change
7. Save as new plan to your Drivepoint "Plans" interface

[Here's](https://docs.drivepoint.io/help/using-the-web-app/quick-edit) a full video walk-through of how to scenario plan in Drivepoint.&#x20;

</details>

<details>

<summary>How can I compare different growth strategies?</summary>

Similar to adjusting wholesale drivers (see question above), you can change certain growth strategies with Quick Edit:&#x20;

* Increase Ad Spend by specific channels
* Decrease CAC
* Increase Wholesale door count
* Change product prices

All you need to do is quickly edit these drivers and save as new plans. Then you can select them in the plans page and click on "Visualize" to view the impact of all of the scenarios visually.&#x20;

<figure><img src="https://1756028981-files.gitbook.io/~/files/v0/b/gitbook-x-prod.appspot.com/o/spaces%2FrjmuDgysAFZevCjf2H6g%2Fuploads%2FsYppa8aquJke55ZGn22X%2Fimage.png?alt=media&amp;token=a07fd9b0-80bb-4ee3-8714-f065aa31e199" alt=""><figcaption></figcaption></figure>

</details>

## For CFOs & VPs of Finance,&#x20;

<details>

<summary>How do I see performance vs. plan?</summary>

You're able to view performance vs. plan multiple different ways\*:&#x20;

**Mid-Month Pacing Summary** down to [Net Income](https://docs.drivepoint.io/help/using-the-web-app/reports/performance-vs.-plan/performance-vs.-plan):&#x20;

1. Open [Drivepoint](https://app.drivepoint.io/)
2. Click on Variance Review
3. Click on "Performance vs. Plan"
4. Select your Plan
5. Select your Channel

**Post Month End Accounting Close Variance reports**

1. Open [Drivepoint](https://app.drivepoint.io/)
2. Click on Variance Review
3. Click on P\&L, Balance Sheet or Cash Flow Variance report
4. Select a Plan
5. Change the month and breakdown
6. Export and send to investors

**Post Month End Accounting Close Variance views in the model**

1. Navigate to the Plans page
2. Open your model (or any Drivepoint plan)
3. Navigate to the blue "Variance Summary" tab
4. Toggle between different tabs to view your performance vs. plan

*\*all Performance vs. Plan features require at least one saved plan in Drivepoint*

</details>

<details>

<summary>Where do I check assumptions behind the forecast?</summary>

The best way is to do this in the Drivepoint model. We're happy to give you a full demo and run-down of how we're building towards your Sales assumptions by channel or your demand plan.&#x20;

</details>

<details>

<summary>How do I model changes to CAC, Ad Spend, etc.?</summary>

Making changes is easy in [Drivepoint](https://app.drivepoint.io/):&#x20;

1. Click on "Plans"
2. Click on "Quick Edit" on the top right of your live model
3. Select any driver (e.g. Blended Paid CAC or Ad Spend Channel) in the drop-down
4. Change the driver by editing the values in the table directly or set it to a specific value via the drop-down
5. Click on "Preview"
6. View the impact of a specific wholesale driver change
7. Save as new plan to your Drivepoint "Plans" interface

[Here's](https://docs.drivepoint.io/help/using-the-web-app/quick-edit) a full video walk-through of how to scenario plan in Drivepoint.&#x20;

Of course, you're also able to do this in any Drivepoint plan as soon as you're a customer of Drivepoint.&#x20;

</details>

<details>

<summary>Can I export this into my board report?</summary>

Yes. As a Drivepoint customer, you get a monthly board report dashboard which contains core reports that might be relevant for your board report (e.g. P\&L Variance, Financial Margins, etc). A dashboard is a collection of reports and you can build your own. If you just want a single report export, you can export any by clicking on the ⬇️ on the top right.&#x20;

</details>

<details>

<summary>Where’s the cash flow tracker?</summary>

We offer a cash flow forecast as additional product module. Talk to your Drivepoint rep to learn more and see it in action.&#x20;

</details>

For COOs and VPs of Ops,&#x20;

<details>

<summary>Do we have visibility into expected POs vs. received?</summary>

Yes. Drivepoint integrates natively with Cin7 Omni + Core. We have out of the box Sales reports to understand expected vs. received POs as well as Gross Sales by retailer. You can also import PO-level information by product and account into any Drivepoint Plan.&#x20;

Talk to us if you want to see Cin7 as part of your Quickstart.&#x20;

</details>

<details>

<summary>Where can I see inventory burn vs. sales pace?</summary>

You can see it in the demand planning report module. Drivepoint integrates with 70+ WMS and 3PLs that allow us to create inventory burn and velocity reports on a Warehouse level.&#x20;

This module is only available for Pro customers.

</details>

<details>

<summary>How do I track performance vs. plan at a SKU level?</summary>

If you use Drivepoint for Demand Planning, open the SKU Summary tab in the model, select a plan and view your performance by SKU.&#x20;

We're happy to send you a 5 min Loom of the SKU-level variance review.&#x20;

</details>

## For Marketing Teams,&#x20;

<details>

<summary>Where’s the LTV by marketing channel?</summary>

1. Open Drivepoint
2. Open the LTV by Dimension Report
3. In the filter on the bottom right, search for a source site or discount code to filter for LTV performance by Marketing

*The LTV by Dimension Report is complex in the way it calculates the maturity of cohorts. Read more in our documentation* [*here*](https://docs.drivepoint.io/help/using-the-web-app/reports/cohort-analysis/ltv-retention-by-dimension)*.*&#x20;

</details>

<details>

<summary>How do I see CAC vs. LTV in one place?</summary>

Drivepoint offers multiple LTV metrics. Our most popular is the Cohorted Financials Report that marries financial and operational data to get to a Contribution Profit LTV After Marketing.&#x20;

1. Open [Drivepoint](https://app.drivepoint.io/)
2. Click on Reports
3. Click on "DTC/Amazon Cohort & LTV Analysis"
4. Open the first report
5. Toggle between CAC and LTV metrics

Another interesting view is our **LTV Benchmarks report where you can compare all of your LTV and CAC performance** to peers.&#x20;

1. Open [Drivepoint](https://app.drivepoint.io/)
2. Click on Reports
3. Click on "Benchmarks"
4. Click on "LTV Benchmarks"
5. Hover over each metric to see your performance

</details>

<details>

<summary>What’s our average payback period?</summary>

1. Open [Drivepoint](https://app.drivepoint.io/)
2. Click on Reports
3. Click on "DTC/Amazon/TikTok Shop Cohort & LTV Performance"
4. Click on the N-Day LTV report
5. Change your metric to "Contribution Profit Less Fully Loaded CAC"

</details>


# Pro Tips & Tricks

Data integrations inform your everything you can find in the Drivepoint Platform and the SmartModel™️. Find out tips & tricks👇

{% embed url="<https://www.loom.com/share/c83e751a72dd4f759032822f76f1dd16?sid=0dad4d79-43eb-490e-9577-44637f04f2a7>" %}
Learn the basics of connecting Shopify, Quickbooks, etc
{% endembed %}

**Pro Tip 1:** Quickbooks (QBO) is very easy to connect to Drivepoint. Connect it in a few minutes to help stand up your model! *Skip this step if your company is not on QBO.*

If you are logged in the [Drivepoint web app](https://app.drivepoint.io/), click on data sources and then on Quickbooks. It should open up a dialogue in the window. After logging into Quickbooks and accepting the permissions you are all set.&#x20;

**Pro Tip 2:** You do not need to be the owner of the Shopify account to connect it to Drivepoint

We have recently updated the permissions necessary to connect your Shopify account to Drivepoint and benefit from importing Direct-to-Consumer data to inform your forecasts. If you are not the owner, find out what specific permissions you need [here](/data-integrations/shopify).


# Shopify

Connecting Drivepoint and Shopify

**Anyone from your team is able to connect the Shopify account through our Quickstart with the following Shopify permissions:**

1. View orders
2. View draft orders
3. View products
4. View metaobject definitions and entries
5. View customers
6. View analytics (reports and dashboards)
7. View, create and delete discounts
8. Manage and install apps and channels (App permissions)

## How do I get these permissions in Shopify?

**If you are an admin in the Shopify account, see the image by image guide below to confirm the necessary permissions:**&#x20;

1. Navigate to Settings of your Shopify Account
2. Select the following permissions (see all 4 screens for the exhaustive list)

<figure><img src="https://2089194542-files.gitbook.io/~/files/v0/b/gitbook-x-prod.appspot.com/o/spaces%2FuPhWdKX288WBK7UyaQZw%2Fuploads%2Ffl0H3Y4TaCMyRk4Vc4mk%2Fshopify_permissions_1.png?alt=media&amp;token=e08e96f1-8218-4a38-9061-413c08e80add" alt=""><figcaption><p>Screen 1/4</p></figcaption></figure>

<figure><img src="https://2089194542-files.gitbook.io/~/files/v0/b/gitbook-x-prod.appspot.com/o/spaces%2FuPhWdKX288WBK7UyaQZw%2Fuploads%2FuYM1LkUfTocU7ZwLZ1Ov%2Fshopify_permissions_2.png?alt=media&amp;token=2bf9ab6d-c06a-4103-9e8b-02ce6575944e" alt=""><figcaption><p>Screen 2/4</p></figcaption></figure>

<figure><img src="https://2089194542-files.gitbook.io/~/files/v0/b/gitbook-x-prod.appspot.com/o/spaces%2FuPhWdKX288WBK7UyaQZw%2Fuploads%2FmIALy3UuHCd9jOen0qlS%2Fshopify_permissions_3.png?alt=media&amp;token=26983bed-e6fa-4b87-8f51-87d76efddcae" alt=""><figcaption><p>Screen 3/4</p></figcaption></figure>

<figure><img src="https://2089194542-files.gitbook.io/~/files/v0/b/gitbook-x-prod.appspot.com/o/spaces%2FuPhWdKX288WBK7UyaQZw%2Fuploads%2FRppzSjslmnsFVNbnSmnD%2Fshopify_permissions_4.png?alt=media&amp;token=01595206-a52b-4590-9bae-8d4c5be78d38" alt=""><figcaption><p>Screen 4/4</p></figcaption></figure>

3. Hit save on the permissions
4. Navigate to back to [Drivepoint](https://app.drivepoint.io/) to connect your Shopify.


# Amazon Seller Central

How to connect Drivepoint and Amazon.

{% embed url="<https://www.loom.com/share/2c024a1ee8324172a47f22f4ef5e8fd2?sid=fbede64d-e836-4690-9558-74932c69e41bw>" %}

[**Loom Link**](https://www.loom.com/share/ab6d426b368941b380c6632aa2fd5ddf)

### **Required Permissions to Connect to AmazonSP**

* You either have to be an **Amazon Seller Central Admin** OR
* **If you're not an admin**, then you need an Amazon Admin to give you "Performance -> Selling Partner Appstore" access. They can do that via User Settings.

*Here's an email of what to send your Amazon SP admin*

*Hi NAME,*

*I would like to request access to "Selling Partner Appstore" in order to connect our Amazon to a FP\&A tool that I am currently demo-ing. Here's what to do:*

1. *Log into* [*Amazon SP User Management*](https://sellercentral.amazon.com/account/permissions#/user-management/users)
2. *Click on "Edit" next to my name*
3. *Select "View & Edit" under "Performance -> Selling Partner Appstore"*

<figure><img src="https://2089194542-files.gitbook.io/~/files/v0/b/gitbook-x-prod.appspot.com/o/spaces%2FuPhWdKX288WBK7UyaQZw%2Fuploads%2Fsm4dyhzMk6FgABR4v3xM%2Fimage.png?alt=media&#x26;token=53ef2330-6bd6-4a81-a3da-f976f4a807ee" alt="" width="375"><figcaption></figcaption></figure>

4. *Keep all other default permissions the same*
5. *Save the configuration*
6. *Done*

*Thank you so much for helping me out!*

## FAQ: Connecting Seller Central to Drivepoint

<details>

<summary>I can't seem to be connecting through the UI. Is there another way?</summary>

Yes! There's a manual way to connect Drivepoint to AmazonSP. You can invite our email <finance@bridgegrowth.com> to AmazonSP. Check out the Loom to learn how to do that and which permissions are required: <https://www.loom.com/share/ab6d426b368941b380c6632aa2fd5ddf>

</details>

<details>

<summary>Why do some Amazon Seller Central Stores not connect to Drivepoint?</summary>

* We tried to pull historical data but unfortunately our data pulls failed because we do not have permissions to the "restricted orders"
* The restricted orders are not necessarily relevant but we currently do not have a way to exclude them in our datapulls
* Hence, the whole things fails because we lack the permission to one of the table

There are some providers that offer to pull the data (through some weird loophole that Amazon seems to be unaware of or weirdly allow). If you are curious to learn more email <support@drivepoint.io>.

**If you want to dive deeper:**

Amazon considered requests for PII data as restricted operations, and require special authorization in the form of a Restricted Data Token (RDT). An RDT allows an authorized applications permissions to to access restricted data such as shipping, tax invoicing, or tax remittance services.

**What is Amazon PII? Amazon's definition of PII:**

"any information that can be used on its own or with other information to identify contact, locate an individual (e.g., Customer), or identify an individual in context. This includes, but is not limited to, a Customer name, address, e-mail address, phone number, gift message content, purchases, and latitude/longitude of buyer addresses".

Amazon Does Not Supply PII For Fulfillment By Amazon (FBA) Traditionally, Amazon's data protection policies limit buyers' access to personally identifiable information (PII). Amazon introduced the policy of not sharing the FBA PII data in 2019. **As a result, Amazon does not share this information via API or your Amazon Seller Central account.**

Restrictions to PII data apply to the Selling Partner API as to the legacy MWS API application. In many ways, the process for accessing PII in the new SP-API is significantly more complex as the review and approval process is extensive.

**Drivepoint does not support PII data requests.**

**Additional Resources:**

<https://developer-docs.amazon.com/sp-api/docs/tokens-api-use-case-guide#terminology>

<https://youtu.be/PbPIHdcHXmA?feature=shared&t=696>

</details>

<details>

<summary>How does Drivepoint identify customers without buyer email?</summary>

As of early 2026, Amazon replaced all buyer email addresses in SP-API fulfilled shipment reports with anonymous proxy addresses (`@marketplace.amazon.com`). This is a permanent change that affects all platforms relying on Amazon order data, not just Drivepoint.

Drivepoint identifies returning customers using shipping address, phone number, and order history patterns. This approach produces high assignment rates (the vast majority of orders get a customer identity), but it is a completeness metric, not an accuracy guarantee. Edge cases like gift orders, address changes, and shared households are harder to resolve without email as a cross-check.

For sellers enrolled in **Amazon Brand Registry**, Brand Analytics Repeat Purchase data provides an independent accuracy calibration that Drivepoint can use to validate the matching.

</details>

## **FAQ: Amazon New vs. Returning Customer Data**

<details>

<summary><strong>What happened to new vs. returning customer data on Amazon?</strong></summary>

In early 2026, Amazon replaced all buyer email addresses in their Selling Partner API fulfilled shipment reports with anonymous proxy addresses (`@marketplace.amazon.com`). This is a permanent change that removed email as a customer identity signal for all platforms that rely on Amazon order data, not just Drivepoint.

Previously, buyer email was one of the signals Drivepoint used to link orders to the same customer. With that signal removed, Drivepoint now relies on shipping address, phone number, and order history patterns to identify returning customers.

</details>

<details>

<summary><strong>Was my data affected?</strong></summary>

If you have an Amazon sales channel connected to Drivepoint, the transition period (approximately February through March 2026) may have had temporarily degraded accuracy while the new matching approach was rolled out. Since then, the address-based matching pipeline has been fully deployed across all accounts.

</details>

<details>

<summary><strong>How does matching work now?</strong></summary>

Drivepoint matches Amazon orders to customers using shipping address, phone number, and order history patterns. This produces high assignment rates: the vast majority of Amazon orders receive a customer identity.

It is important to understand what this means. **Completeness** (what percentage of orders get assigned a customer identity) is high. **Accuracy** (whether each assignment is correct) is harder to measure directly because Amazon does not provide a ground-truth customer ID. Edge cases like gift orders, address changes, and shared households can cause a single real customer to appear as multiple customers, or vice versa.

For sellers enrolled in **Amazon Brand Registry**, Brand Analytics Repeat Purchase data can serve as an independent check on the accuracy of new vs. returning segmentation.

</details>

<details>

<summary><strong>What is Brand Analytics and how does it help?</strong></summary>

Amazon Brand Analytics is available to sellers enrolled in Amazon Brand Registry. It includes a Repeat Purchase report that shows, at the ASIN level, how many orders came from new vs. returning customers, based on Amazon's own internal customer identity.

Drivepoint can use this data as a calibration layer to validate and improve the accuracy of our address-based customer matching. If you are enrolled in Brand Registry, reach out to your Drivepoint contact to discuss enabling this.

</details>

<details>

<summary><strong>What if I notice something off in my historical data?</strong></summary>

Reach out to your Drivepoint contact and we'll review it with you. Most accounts will see no material difference, but a small number of customers experienced shifts of a few percentage points during the transition.
</details>

Resources:

<https://developer-docs.amazon.com/sp-api/docs/tokens-api-use-case-guide#terminology>


# Quickbooks

Quickbooks can be easily authenticated in the Drivepoint UI

## Get QBO Data into Drivepoint

1. Click on "New Data Source"
2. Click on the "Quickbooks" logo
3. Authenticate QBO within Drivepoint. **You have to be a QBO Admin to connect to Drivepoint.**&#x20;
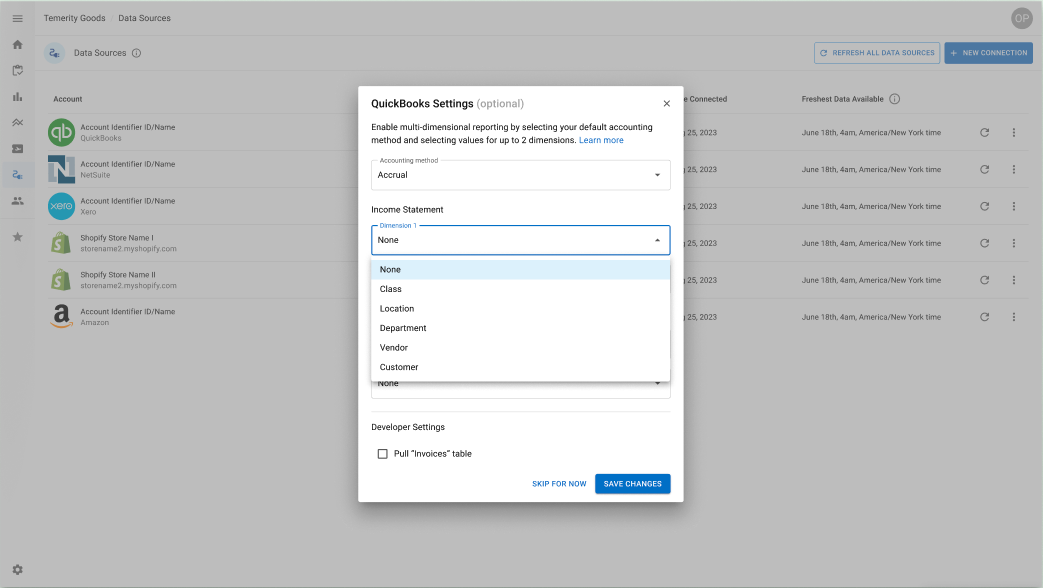
4. After a successful authentication, **please complete the QBO Settings to start the first data pull.**&#x20;

<figure><img src="https://2089194542-files.gitbook.io/~/files/v0/b/gitbook-x-prod.appspot.com/o/spaces%2FuPhWdKX288WBK7UyaQZw%2Fuploads%2FKXUzfvX30WMSa9HTBVi1%2Fimage.png?alt=media&amp;token=a28be5b4-cef3-4d2f-8581-6c58cc91dfa5" alt=""><figcaption></figcaption></figure>

5. Fill out whether you would like any dimensions associated with the Income Statement and the Balance Sheet. Default is unclassed for every customer so you can proceed without making changes.
6. You can also change if you would like your accounting method to be cash or accrual.&#x20;
7. You are also able to indicate from when you'd like to start pulling data. 💡 You can change the year and month, please keep the time (TZ) the same. **We suggest our default of pulling data from 2015 is usually sufficient**
8. **Save your Changes.** If you do not save changes, we won't start pulling QBO data.
9. **Done**🎉  Your QBO is now connected to Drivepoint


# Netsuite Financials

## Overview

The simplest way to connect Netsuite to Drivepoint is to enable nightly automated email reports to an email address specifically created for import into Drivepoint. The below guide details how to configure and enable this connection. If you are interested in a more custom approach utilizing FTP or a Cloud Storage Bucket, please see the guides below and contact your CSM team for support.

### Integration Methods

<details>

<summary><mark style="color:blue;">Email Method (Recommended)</mark></summary>

1. **Step 1 - Find your dedicated Drivepoint x Netsuite email address**

   Your NetSuite email address is automatically generated when you add a NetSuite data source in the Drivepoint web app. Navigate to **Sources > Add Source > NetSuite** and you will see your dedicated email address displayed on the configuration page.

   The format is: `netsuite+{your-company-id}@drivepoint.io`

   No setup or provisioning is needed. The address is ready to receive reports as soon as you see it in the app.

   > **Existing customers:** If you were set up before August 2026, your email may use the legacy format `{companyId}-netsuite@bainbridgegrowth.com`. Both formats continue to work. You do not need to change your scheduled reports.
2. **Step 2 - Create Drivepoint as a Vendor in Netsuite** To create a vendor record in Netsuite:

   1. Go to Lists
   2. Click Relationships
   3. Click Vendors
   4. Click New
   5. Enter the email from Step 1 above and any required fields.
   6. Click Save.

   Netsuite article on adding vendor: <https://docs.oracle.com/en/cloud/saas/netsuite/ns-online-help/section\\_N2362161.html>
3. **Step 3 - Configure Custom Reports**

   Configure two new custom reports, based on Netsuite Standard Reports. You will need to customize each report to use a 'monthly' date breakdown. The reports that need customization are:

   1. Income Statement report file should be in CSV format named `income_statement`
   2. Balance Sheet report file should be in CSV format named `balance_sheet`
4. **Step 4 - Set Up Nightly Delivery to your Drivepoint x Netsuite email address**

**We will walk you through each of the steps in detail below.**

</details>

<details>

<summary>FTP Method</summary>

1. You'll need to create a destination on your FTP server where reports will be uploaded from Netsuite. Make sure uploaded report files have proper name and format and are replaced with a fresh ones at the desired frequency:
   1. Income Statement report file should be in CSV format named `income_statement`
   2. Balance Sheet report file should be in CSV format named `balance_sheet`
2. Provide us with the following data to access FTP for those reports:
   1. FTP host
   2. FTP port
   3. username
   4. password
   5. directory path on FTP with reports

</details>

<details>

<summary>Direct Delivery via Upload to Cloud Storage Bucket</summary>

1. We will create `netsuite_reports` bucket in your Cloud Storage storage and prepare service account JSON access key that will have access only to that bucket.
2. You can then use provided key to connect your service to `netsuite_reports` bucket.
3. You can then set up Netsuite reports upload, make sure uploaded report files have proper name and format and are replaced with a fresh ones at the desired frequency:
   1. Income Statement report file should be in CSV format named `income_statement`
   2. Balance Sheet report file should be in CSV format named `balance_sheet`

</details>

## Email Method - Setting up Custom Reports in Netsuite

Custom reports will ensure that the Drivepoint forecasts incorporate the correct Netsuite data and data is synced daily.

<details>

<summary>Step-by-step Balance Sheet Setup Guide</summary>

The balance sheet should look like [this](https://docs.google.com/spreadsheets/d/1kHBuef22-2tyReRTDsUgAJhh7D6BhVEGfZa5tIggyvc/edit#gid=0) sample Balance Sheet. Feel free to keep it open while you are going through the setup guide to compare.

1. Open Netsuite in your browser
2. Click on "Reports" field in the top navigation bar
3. Select "New Financial Report"
4. Select "Balance Sheet" in the view list of all reports
5. Name "Drivepoint Balance Sheet"
6. Click on "Edit Columns" in the header next to "Edit Layout"
7. Select "Accounting Period" in "View by Columns Field"
8. Click on "Preview" to see the balance sheet
9. Navigate to the footer of the balance sheet preview to set the periods
10. "End Of": should say "Custom"
11. "As of": set to earliest month of financial records
12. "Column": should say "Accounting period"
13. Click "Save" in the Financial Report Builder
14. Navigate to the right footer of the balance sheet
15. Click on the "Calendar icon"
16. Select the date of tomorrow as the first day of sending it
17. Select a time at night (2-5am) to send the report to the Drivepoint team
18. Click on the check box: "Run report more than once"
19. Select "Daily Event"; Repeat every "1" day (NO end date)
20. Select Drivepoint as the vendor for the CSV send
21. Click on "Message" in the blue navigation bar next to "Recipients"
22. Type in "balance\_sheet" in the message text box
23. Select "CSV" from drop-down menu below the message text box
24. Hit save
25. Double check the scheduled report is showing up by navigating to "Reports" > "Scheduled Reports"
26. You set up the balance sheet report! Move to the income statement.

</details>

<details>

<summary>Step-by-step Income Statement Setup Guide</summary>

Most clients have additional dimensions segmenting the financial rows from the account periods. [Here](https://docs.google.com/spreadsheets/d/1zwfo4fTYrCK8HJ-tzMU96pu_Hx_B8P7IbVcfGOB94Xk/edit#gid=0) is a template of how the income statement with classes should look like.

1. Open Netsuite in your browser
2. Click on "Reports" field in the top navigation bar
3. Select "New Financial Report"
4. Select "Income Statement" in the view list of all reports
5. Name "Drivepoint Income Statement"
6. Click on "Edit Columns" in the header next to "Edit Layout"
7. Select "Accounting Period" in "View by Columns Field"
8. Search for your desired dimension in the search box on the left
9. Drag the class you selected into the table on the right
10. Move left or right to place them in between the financial rows and accounting period
11. Click on "Preview" to see the income statement
12. Double check that you have selected the correct classes
13. Navigate to the footer in the income statement preview to set the periods
14. "End Of": should say "Custom"
15. "As of": set to earliest month of financial records
16. "Column": should say "Accounting period"
17. Click "Refresh" and see any potential updates
18. Click "Save" in the Financial Report Builder to save the "Drivepoint Income Statement"
19. Navigate to the right footer of the income statement
20. Click on the "Calendar icon"
21. Select the date of tomorrow as the first day of sending it
22. Select a time at night (2-5am) to send the report to the Drivepoint team
23. Click on the check box: "Run report more than once"
24. Select "Daily Event"; Repeat every "1" day (NO end date)
25. Select Drivepoint as the vendor for the CSV send
26. Click on "Message" in the blue navigation bar next to "Recipients"
27. Type in "income\_statement" in the message textbox
28. Select "CSV" from drop-down menu below the message textbox
29. Hit save to save the scheduled daily report
30. Double check the scheduled report is showing up by navigating to "Reports" > "Scheduled Reports"
31. You set up the income statement report!

**LAST IMPORTANT STEP**: Navigate to the Drivepoint web-app and click on "Connect Netsuite" on the bottom right. You should see a field that is toggled on to show the live Netsuite integration.

</details>

## Frequently Asked Questions

#### **Which email should I use for setting up the email integration?**

Your NetSuite email address is shown automatically in the Drivepoint web app when you add a NetSuite data source. Go to **Sources > Add Source > NetSuite** and copy the email displayed on the configuration page.

New customers receive an address in the format `netsuite+{companyId}@drivepoint.io`. Existing customers may have the legacy format `{companyId}-netsuite@bainbridgegrowth.com`. Both formats work and will continue to be supported. If you don't see an email on the configuration page, please contact <support@drivepoint.io> with the subject line: "Missing Drivepoint Login for Netsuite".

#### **I am not sure where to start with this. What are the basics I should do?!**

1. All you really need to get started is to create 2 reports:
   1. [Income Statement](https://docs.google.com/spreadsheets/d/1zwfo4fTYrCK8HJ-tzMU96pu_Hx_B8P7IbVcfGOB94Xk/edit?usp=sharing)
   2. [Balance Sheet](https://docs.google.com/spreadsheets/d/1kHBuef22-2tyReRTDsUgAJhh7D6BhVEGfZa5tIggyvc/edit?usp=sharing)
2. You can always add other reports later and adding extra dimensions for the P\&L including class, sales channel, etc., it is not needed for the stage of setting up the integration.
3. Navigate to the "Step by Step Balance Sheet Setup Guide" to get started before continuing to setup the Income Statement.

#### **My data is not showing up in my add-in. What should I do?**

Your data will only show up after the first email has been sent from Netsuite. It could therefore take some time to show up. If you still have concerns after 48h, email <support@drivepoint.io> or speak to your Drivepoint Representative.

#### **I would like to have extra granularity in my forecasting. What should I do?**

If you would like to have extra granularity in your financial model Drivepoint supports two extra dimensions (columns) for a Netsuite report.

You will need to:

1. Prepare the report in Netsuite in the format similar to the image below with column B being "Class" and column C being any other extra dimension. Or find the link to the sample Income Statement [here](https://docs.google.com/spreadsheets/d/1zwfo4fTYrCK8HJ-tzMU96pu_Hx_B8P7IbVcfGOB94Xk/edit?usp=sharing).
2. Send the report sample via email (<support@drivepoint.io> with the subject: "Custom Netsuite Report"), slack your Drivepoint representative or bring it up in the next call with the Drivepoint team so we can properly map those columns to the internal fields.
3. Schedule the report delivery in Netsuite to your custom Netsuite-Drivepoint integration email.


# FAQ: Netsuite Financials Integration

Some of the most common questions regarding the Netsuite Financials Integration.

#### **Which email should I use for setting up the email integration?**

1. Get access to Drivepoint via the email invite from your Drivepoint Representative or <no-reply@drivepoint.io> in your inbox.&#x20;

   *Make sure to check your spam folder as well.*&#x20;
2. The format of the email you will need to schedule Netsuite reports to should look like the following: <companyname-netsuite@bainbridgegrowth.com>
3. Did not receive an email? Please email [support@drivepoint.io](mailto:cs@drivepoint.io) with the subject line: “Missing Drivepoint Login for Netsuite”.&#x20;

#### **I am not sure where to start with this. What are the basics I should do?!**

1. All you really need to get started is to create 2 reports:&#x20;
   1. [Income Statement](https://docs.google.com/spreadsheets/d/1zwfo4fTYrCK8HJ-tzMU96pu_Hx_B8P7IbVcfGOB94Xk/edit?usp=sharing)
   2. [Balance Sheet](https://docs.google.com/spreadsheets/d/1kHBuef22-2tyReRTDsUgAJhh7D6BhVEGfZa5tIggyvc/edit?usp=sharing)
2. You can always add other reports later and adding extra dimensions for the P\&L including class, sales channel, etc., it is not needed for the stage of setting up the integration.
3. Navigate to the ["Step by Step Balance Sheet Setup Guide"](#step-by-step-balance-sheet-setup-guide) to get started before continuing to [setup the Income Statement](#step-by-step-income-statement-setup-guide)

#### **My data is not showing up in my add-in. What should I do?**

![](https://lh7-us.googleusercontent.com/YsVdGjPeWW7GFtSQ5FGV5yyeXAxKNtvXG3oczDOjdhu7gbHW6k7lciEiTJPg_RCoLFVQ7CLJNwbkHG43Fde_ts-8YNodnKCB_CTWU8aYCEWElVt6wA_9PtH2kFNCGXCJv1V338AQn4B3aSgdEdRLlbk)<br>

Your data will only show up after the first email has been sent from Netsuite. It could therefore take some time to show up. If you still have concerns after 48h, email [support@drivepoint.io](mailto:cs@drivepoint.io) or speak to your Drivepoint Representative.&#x20;

#### **I would like to have extra granularity in my forecasting. What should I do?**

*💡Some of our clients create extra reports for incorporating granular data from various channels*

If you would like to have extra granularity in your financial model Drivepoint supports two extra dimensions (columns) for a Netsuite report

You will need to:

1. Prepare the report in Netsuite in the format similar to the image below with column B being “Class” and column C being any other extra dimension. Or find the link to the sample Income Statement [here](https://docs.google.com/spreadsheets/d/1zwfo4fTYrCK8HJ-tzMU96pu_Hx_B8P7IbVcfGOB94Xk/edit?usp=sharing).&#x20;
2. Send the report sample via email ([support@drivepoint.io](mailto:cs@drivepoint.io) with the subject: “Custom Netsuite Report”), slack your Drivepoint representative or bring it up in the next call with the Drivepoint team so we can properly map those columns to the internal fields.
3. Schedule the report delivery in Netsuite to your custom Netsuite-Drivepoint integration email. &#x20;


# Retailer Integrations

💡 You will need the Wholesale Add-On in order to integrate with retailers.

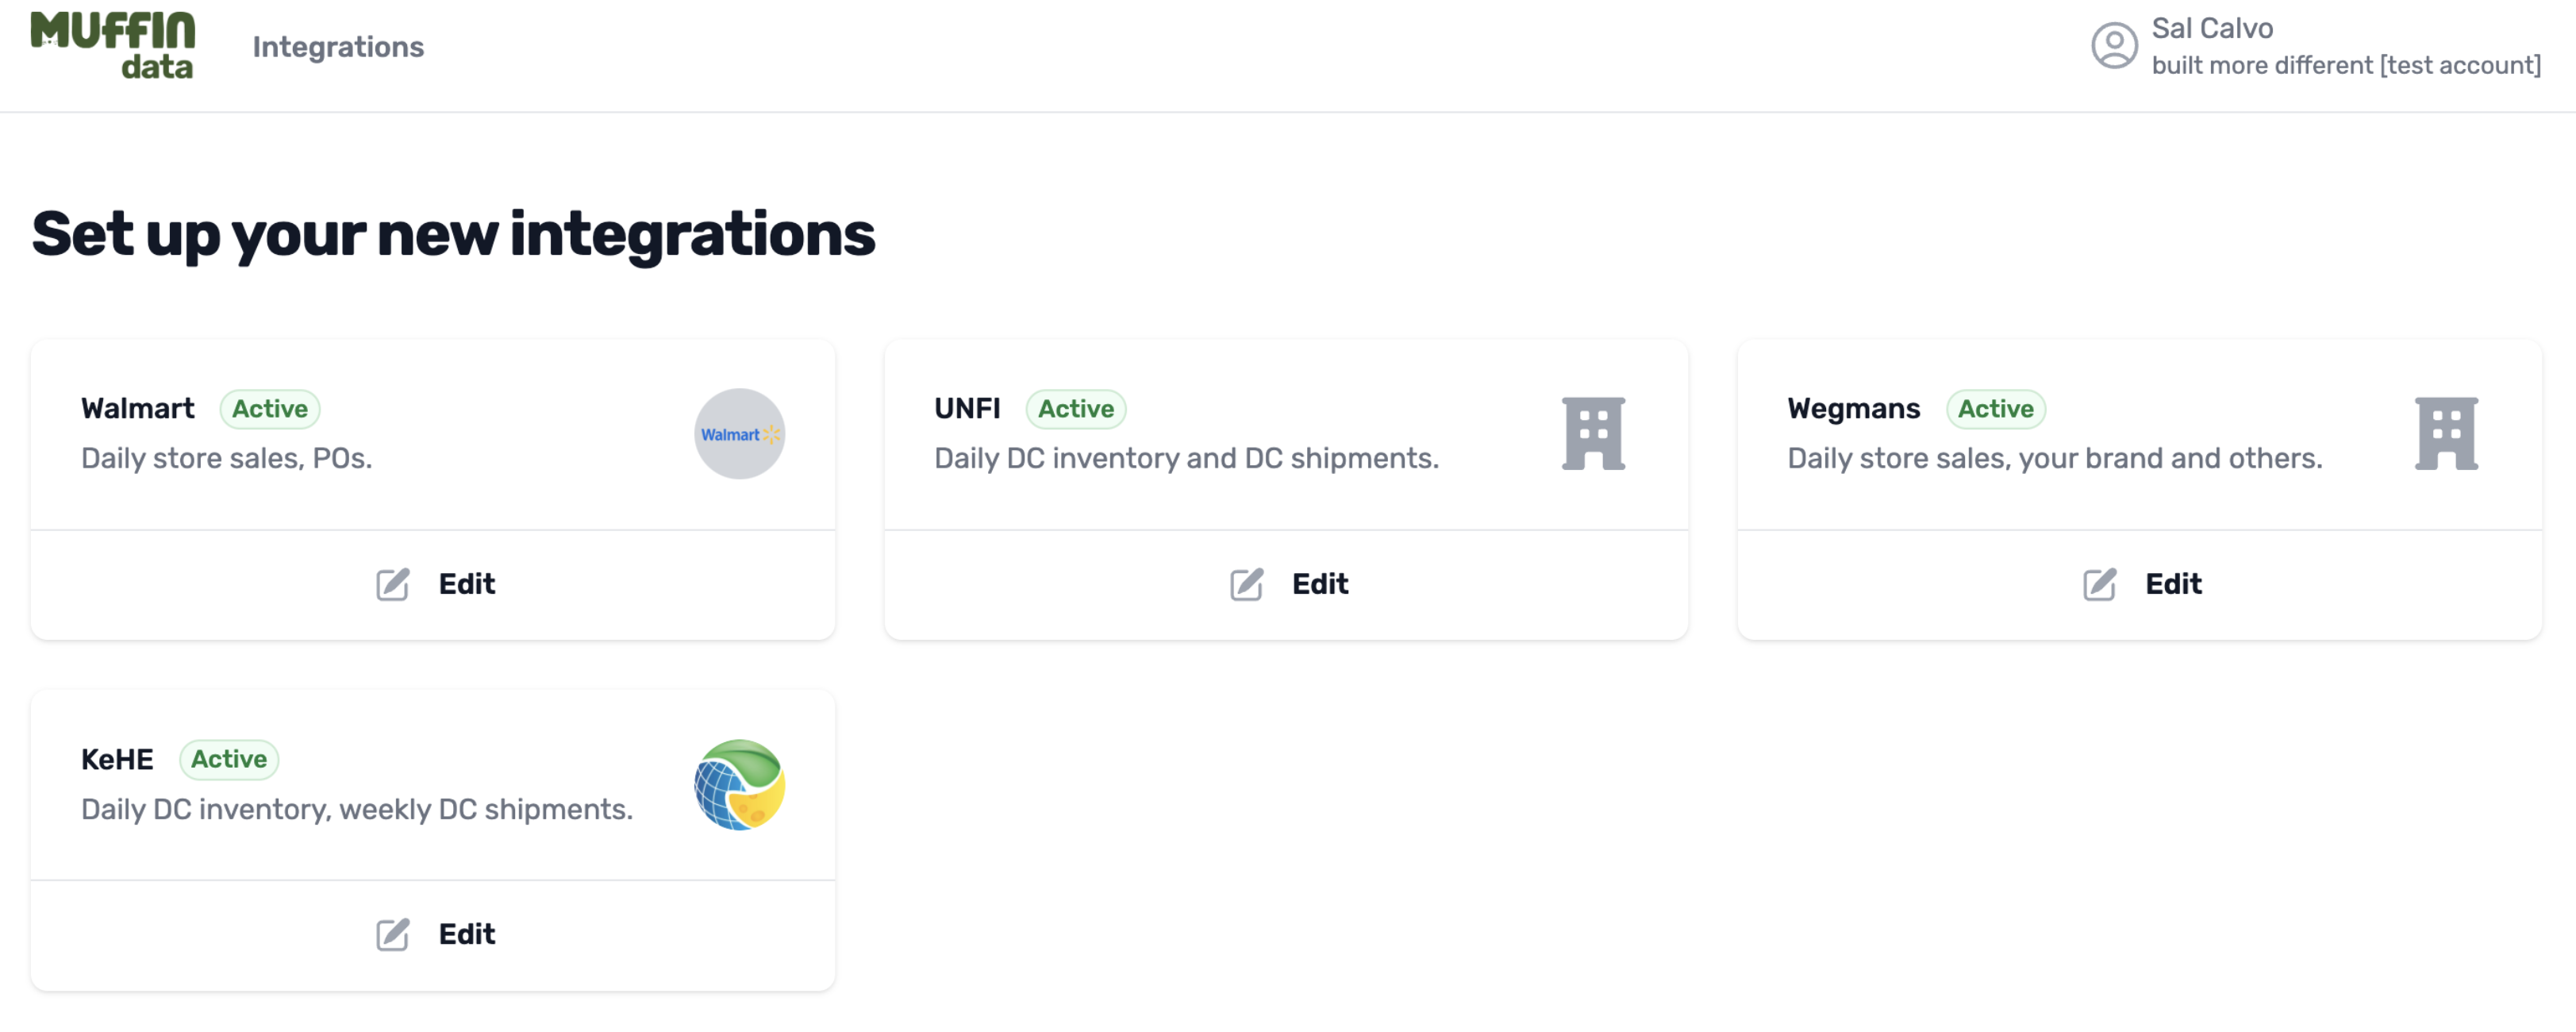
Thanks to our amazing partnership with [Muffin Data](https://www.drivepoint.io/muffin-data), we are able to power your wholesale forecasting easily. Muffin Data connects seamlessly with major retailers and sends Drivepoint's platform reliable wholesale data frequently so you can see granular wholesale data on a weekly basis.

**Supported Retailer Integrations**

<figure><img src="https://2089194542-files.gitbook.io/~/files/v0/b/gitbook-x-prod.appspot.com/o/spaces%2FuPhWdKX288WBK7UyaQZw%2Fuploads%2F0Y0Xs87UMFYaAXZSUTsj%2Fimage.png?alt=media&amp;token=26bb2313-2964-4a10-80b6-faffa43a3cd6" alt=""><figcaption><p>&#x26; many more</p></figcaption></figure>

#### **How do I hook up my Wholesale Data to Drivepoint?** <a href="#how-do-i-hook-up-my-wholesale-data-to-drivepoint" id="how-do-i-hook-up-my-wholesale-data-to-drivepoint"></a>

1. Purchase the Wholesale Add-On *(👀get in touch with your Customer Success rep if you want to learn more!)*
2. Select as many retail integrations from the 'menu' as you'd like
3. Keep your eyes peeled for an email containing an invite to the Muffin Data platform to add your retailer login infos
4. Sign into the portal and connect all of your data sources seamlessly in the Muffin Data platform

<figure><img src="https://files.gitbook.com/v0/b/gitbook-x-prod.appspot.com/o/spaces%2FuPhWdKX288WBK7UyaQZw%2Fuploads%2FsCcOq8cKwaCnLmmJHJZp%2Fimage.png?alt=media&#x26;token=5ccc07a5-b738-4393-bdb7-ed9fd311a7e5" alt=""><figcaption><p>Retailer Integration Setup View in Muffin Data</p></figcaption></figure>

5. Once you added the login infos for all desired retailers, you can lean back and enjoy a cup of coffee while we stand up the Wholesale schedule in your SmartModel™ ☕️
6. The Drivepoint team will be in touch in the following days and show you the newly added Wholesale forecasts in the SmartModel™️, 1-Click Import of Retailer Data functionality and core out-of-the-box wholesale trend and variance reports

​*If you want to get started asap, get in touch with us!*

{% content-ref url="/spaces/GWP01Uan8w7wePRkCAQS/pages/JIL9p5hP3IZ9pTXZcuqP" %}
[Contact Us](/help-1)
{% endcontent-ref %}


# BigQuery

This page describes how to configure direct access to your Drivepoint-managed BigQuery data warehouse.

{% hint style="info" %}
**Note:** Access to this feature requires a subcription to the Advanced Analytics Add-On. Please contact your customer success manager for more information.
{% endhint %}

### Overview

The easiest way to configure access to your Drivepoint data warehouse is via a google group (or any email group on their side). This has a few advantages which are:

* Customers can provision or de-provision the users in their organization without needing to contact Drivepoint support
* Onboarding / Offboarding from a Drivepoint perspective is easy as we simply have to add/remove the group and not individual users

### Step 1 - Create a Google group alias and add users

1. Go to [groups.google.com](http://groups.google.com) and follow the instructions for [creating a new group](https://apps.google.com/supportwidget/articlehome?hl=en\&article_url=https%3A%2F%2Fsupport.google.com%2Fa%2Fanswer%2F9400082%3Fhl%3Den\&assistant_id=generic-unu\&product_context=9400082\&product_name=UnuFlow\&trigger_context=a)
2. Give your group with a descriptive name/address, something like `drivepoint-dwh@mycompany.com`
3. Add any users from your organization to the group. All the users you add to the group will be granted access to your BigQuery instance.&#x20;

### Step 2 - Provide your Drivepoint CSM with the fully qualified email address for that group.

1. Provide that group name to your Drivepoint CSM
2. Once access has been provisioned, we'll reach out with confirmation and provide you with a unique URL to access the BigQuery resources.&#x20;

### Step 3 - Verify Access

1. Visit the URL provided by your Drivepoint CSM in the previous step.&#x20;
2. Run a test query to confirm you have correct data access and permisions to access and query the data&#x20;

**That's it! You can now work with your BigQuery data:**

* directly in the [BigQuery UI](https://cloud.google.com/bigquery/docs/bigquery-web-ui#overview)
* in a [connected Google sheet](https://cloud.google.com/bigquery/docs/connected-sheets#use)
* in a 3rd party BI tool like Looker or [Looker Studio](https://support.google.com/looker-studio/answer/6370296?hl=en#zippy=%2Cin-this-article), or
* via any third party SQL editor that supports BigQuery as a datasource

Happy analyzing!


# Financials Datamart

Direct SQL access to QuickBooks GL data, transaction drill-down, and entity-level detail. Available through the Drivepoint MCP and BigQuery.

Your general ledger, invoices, bills, and payments from your ERP are available directly in Drivepoint. Ask questions about your financial statements, drill into transaction detail, analyze revenue by product, and check what is owed or outstanding.

### What you can do with it

* **Review your P\&L and balance sheet** by account and period, using the same categories mapped in your SmartModel.
* **Break down revenue by product** using invoice line items, sliced by account family, product, or customer.
* **Check AR and AP aging** to see which invoices are overdue and what bills are outstanding.
* **Drill from summary to detail** by moving from financial statement totals down to the individual transactions behind them.
* **Audit your mapping coverage** to understand how completely your chart of accounts is mapped in Drivepoint, weighted by dollar value.

### What it covers

| Area                      | What it answers                                                                     | Page                                                                                           |
| ------------------------- | ----------------------------------------------------------------------------------- | ---------------------------------------------------------------------------------------------- |
| Financial statements      | What does my P\&L look like this quarter? Which balance sheet accounts changed?     | [Financial Statements](/data-integrations/financials-datamart/financial-statements)            |
| Invoices & revenue        | What are my top products by revenue? Which invoices are overdue?                    | [Invoices & Revenue](/data-integrations/financials-datamart/invoices-and-revenue)              |
| Bills, payments & vendors | What do I owe? Who are my largest vendors?                                          | [Bills, Payments & Vendors](/data-integrations/financials-datamart/bills-payments-and-vendors) |
| General ledger            | What transactions hit marketing spend last month? What journal entries were posted? | [General Ledger](/data-integrations/financials-datamart/general-ledger)                        |

{% hint style="info" %}
**Financials vs. SmartModel actuals.** The financials data surfaces your raw ERP and ledger truth. SmartModel actuals surface the modeled, mapped view used in your forecasts. They complement each other: use financials when you need the original ledger detail or transaction records, and SmartModel actuals when you need the Drivepoint-mapped forecast view.
{% endhint %}

### Time periods

Financial data is organized at two levels of detail.

| Grain           | What you get                                                                   |
| --------------- | ------------------------------------------------------------------------------ |
| Monthly         | Income statement and balance sheet rolled up by period                         |
| Per transaction | Individual invoices, bills, payments, and GL entries with their original dates |

### QuickBooks and NetSuite

The transaction layer (invoices, bills, payments, vendors) pulls from QuickBooks Online. If your company uses NetSuite, the financial statements and general ledger are still available, but the transaction detail pages will not have data.

{% hint style="warning" %}
**Invoice line quantities** mix units of measure depending on the item (cases vs. individual units). Do not sum quantities across different items without normalizing for unit type.
{% endhint %}


# Financial Statements

Your income statement, balance sheet, and chart of accounts, pulled directly from your ERP and mapped to Drivepoint categories.

### Use it to:

* Review P\&L performance by account and period
* Check balance sheet positions over time
* See which Drivepoint category each GL account maps to
* Identify unmapped accounts and gauge how much dollar volume they represent

### Income statement

| Metric              | What it tells you                               | Notes                                                                |
| ------------------- | ----------------------------------------------- | -------------------------------------------------------------------- |
| Net change          | Revenue or expense amount for the period        | Positive = inflow for revenue accounts, outflow for expense accounts |
| Drivepoint category | The mapped SmartModel category for each account | Unmapped accounts show as blank                                      |
| Account name        | The original GL account name from your ERP      |                                                                      |
| Period              | Month the amounts apply to                      | First and last day of each period                                    |

### Balance sheet

| Metric         | What it tells you                                     | Notes                              |
| -------------- | ----------------------------------------------------- | ---------------------------------- |
| Ending balance | Account balance at period end                         | Cumulative, not a period change    |
| Net change     | Movement in the account during the period             | Useful for spotting unusual swings |
| Statement type | Whether the account is an asset, liability, or equity |                                    |

### Chart of accounts

| Metric              | What it tells you                               | Notes                                                                 |
| ------------------- | ----------------------------------------------- | --------------------------------------------------------------------- |
| Account ID and name | Every GL account in your ERP                    |                                                                       |
| Drivepoint category | What each account maps to in your SmartModel    | Blank if unmapped                                                     |
| Sign convention     | Whether Drivepoint flips the sign for reporting | Some accounts (revenue, liabilities) follow opposite-sign conventions |

### Mapping coverage

| Metric                       | What it tells you                                                       | Notes                                                                                              |
| ---------------------------- | ----------------------------------------------------------------------- | -------------------------------------------------------------------------------------------------- |
| Mapped vs. unmapped accounts | How many GL accounts have a Drivepoint category assigned                | By count and by dollar value                                                                       |
| Dollar-weighted coverage     | What percentage of your total GL activity flows through mapped accounts | A few high-volume unmapped accounts can mean low effective coverage even with most accounts mapped |

{% hint style="info" %}
**Mapping coverage is weighted by dollar value, not just account count.** An unmapped account that carries $1M in activity matters more than ten unmapped accounts with $100 each. Use coverage to prioritize which accounts to map next.
{% endhint %}


# Invoices & Revenue

Invoice headers and line-item detail from QuickBooks, with product and customer breakdowns for revenue analysis.

### Use it to:

* See which products and customers drive your top line
* Check AR aging and find overdue invoices
* Drill into line-item detail to understand product mix
* Track invoice status (paid, open, overdue) and days outstanding

### Invoice metrics

| Metric        | What it tells you                   | Notes                               |
| ------------- | ----------------------------------- | ----------------------------------- |
| Total amount  | Invoice total in your base currency |                                     |
| Balance       | Amount still outstanding            | Zero means fully paid               |
| Due date      | When payment is expected            | Compare to today for aging          |
| Days past due | How overdue the invoice is          | Only meaningful for unpaid invoices |
| Customer      | Who the invoice was sent to         |                                     |
| Status        | Open, paid, or voided               |                                     |

### Invoice line detail

| Metric            | What it tells you                         | Notes                                                                              |
| ----------------- | ----------------------------------------- | ---------------------------------------------------------------------------------- |
| Product / service | The item on each line                     |                                                                                    |
| Quantity          | Units sold on this line                   | Units vary by item (cases vs. eaches). Do not sum across items without normalizing |
| Unit price        | Price per unit on this line               |                                                                                    |
| Line amount       | Total for this line                       |                                                                                    |
| Revenue line flag | Whether this line is a sales revenue line | TRUE only for 41xxx sales account families                                         |
| Account family    | The account number prefix grouping        | Useful for filtering by revenue type or expense category                           |

{% hint style="info" %}
**Revenue line scope.** The revenue flag covers core sales (41xxx account families). If you need a broader revenue definition that includes allowances or adjustments, filter by account family directly rather than relying on the flag.
{% endhint %}

{% hint style="warning" %}
**QuickBooks only.** Invoice data comes from QuickBooks Online. If your company uses NetSuite, this page will not have data. Your financial statements and general ledger are still available.
{% endhint %}


# Bills, Payments & Vendors

Bills, purchase transactions, payment records, and vendor detail from QuickBooks for accounts payable and spend analysis.

### Use it to:

* Check what bills are outstanding and what has been paid
* Analyze spending by vendor
* Track payment timing and AP aging
* Review purchase transactions alongside bills

### Bill metrics

| Metric       | What it tells you   | Notes                 |
| ------------ | ------------------- | --------------------- |
| Total amount | Bill total          |                       |
| Balance      | Amount still owed   | Zero means fully paid |
| Due date     | When payment is due |                       |
| Vendor       | Who issued the bill |                       |
| Status       | Open or paid        |                       |

### Payment metrics

| Metric             | What it tells you                  | Notes                          |
| ------------------ | ---------------------------------- | ------------------------------ |
| Payment amount     | How much was paid                  |                                |
| Payment date       | When the payment was made          |                                |
| Payment method     | How it was paid (check, ACH, etc.) | When available from QuickBooks |
| Customer or vendor | Who the payment was to or from     |                                |

### Purchase metrics

| Metric             | What it tells you                    | Notes |
| ------------------ | ------------------------------------ | ----- |
| Transaction amount | Purchase total                       |       |
| Vendor             | Who the purchase was from            |       |
| Account            | GL account the purchase was coded to |       |

### Vendor directory

| Metric        | What it tells you                      | Notes |
| ------------- | -------------------------------------- | ----- |
| Vendor name   | All vendors in your QuickBooks         |       |
| Active status | Whether the vendor is currently active |       |
| Balance       | Outstanding amount owed to this vendor |       |

{% hint style="warning" %}
**QuickBooks only.** Bill, payment, purchase, and vendor data comes from QuickBooks Online. If your company uses NetSuite, this page will not have data. Your financial statements and general ledger are still available.
{% endhint %}


# General Ledger

Transaction-level general ledger detail, including all transaction types and journal entries, mapped to your Drivepoint categories.

### Use it to:

* Drill into specific GL transactions behind a financial statement line
* Review journal entries posted during a period
* See all transaction types (invoices, bills, payments, journal entries) in one unified view
* Trace how each transaction maps to your Drivepoint SmartModel categories

### GL transaction metrics

| Metric              | What it tells you                               | Notes                            |
| ------------------- | ----------------------------------------------- | -------------------------------- |
| Transaction date    | When the transaction was recorded               |                                  |
| Transaction type    | Invoice, bill, payment, journal entry, or other |                                  |
| Amount              | Debit or credit amount                          |                                  |
| Account             | GL account the transaction posted to            |                                  |
| Drivepoint category | The mapped SmartModel category                  | Blank if the account is unmapped |
| Class / department  | Cost center or department, if used in your ERP  |                                  |
| Memo                | Transaction description or reference            | When available                   |

### Journal entry metrics

| Metric       | What it tells you                 | Notes |
| ------------ | --------------------------------- | ----- |
| Entry date   | When the journal entry was posted |       |
| Line amounts | Debit and credit for each line    |       |
| Account      | GL account for each line          |       |
| Memo         | Description of the entry          |       |

### Item and product directory

| Metric        | What it tells you                        | Notes |
| ------------- | ---------------------------------------- | ----- |
| Item name     | Products and services in your QuickBooks |       |
| Item type     | Inventory, non-inventory, or service     |       |
| Active status | Whether the item is currently active     |       |

{% hint style="info" %}
**GL transactions combine all sources.** The general ledger view joins transaction data with your Drivepoint account mapping, so you can filter by SmartModel category across all transaction types. This is useful for reconciling the mapped view back to individual source records.
{% endhint %}


# TikTok Shop

Connect your Tik Tok Shop data to Drivepoint to forecast for the channel and get all historical Sales data.

{% embed url="<https://www.loom.com/share/819cfa01720d45428ffa19c77526d7f4>" %}

## Step by Step Instructions

1. Navigate to Data Sources in Drivepoint
2. Click on New Connection
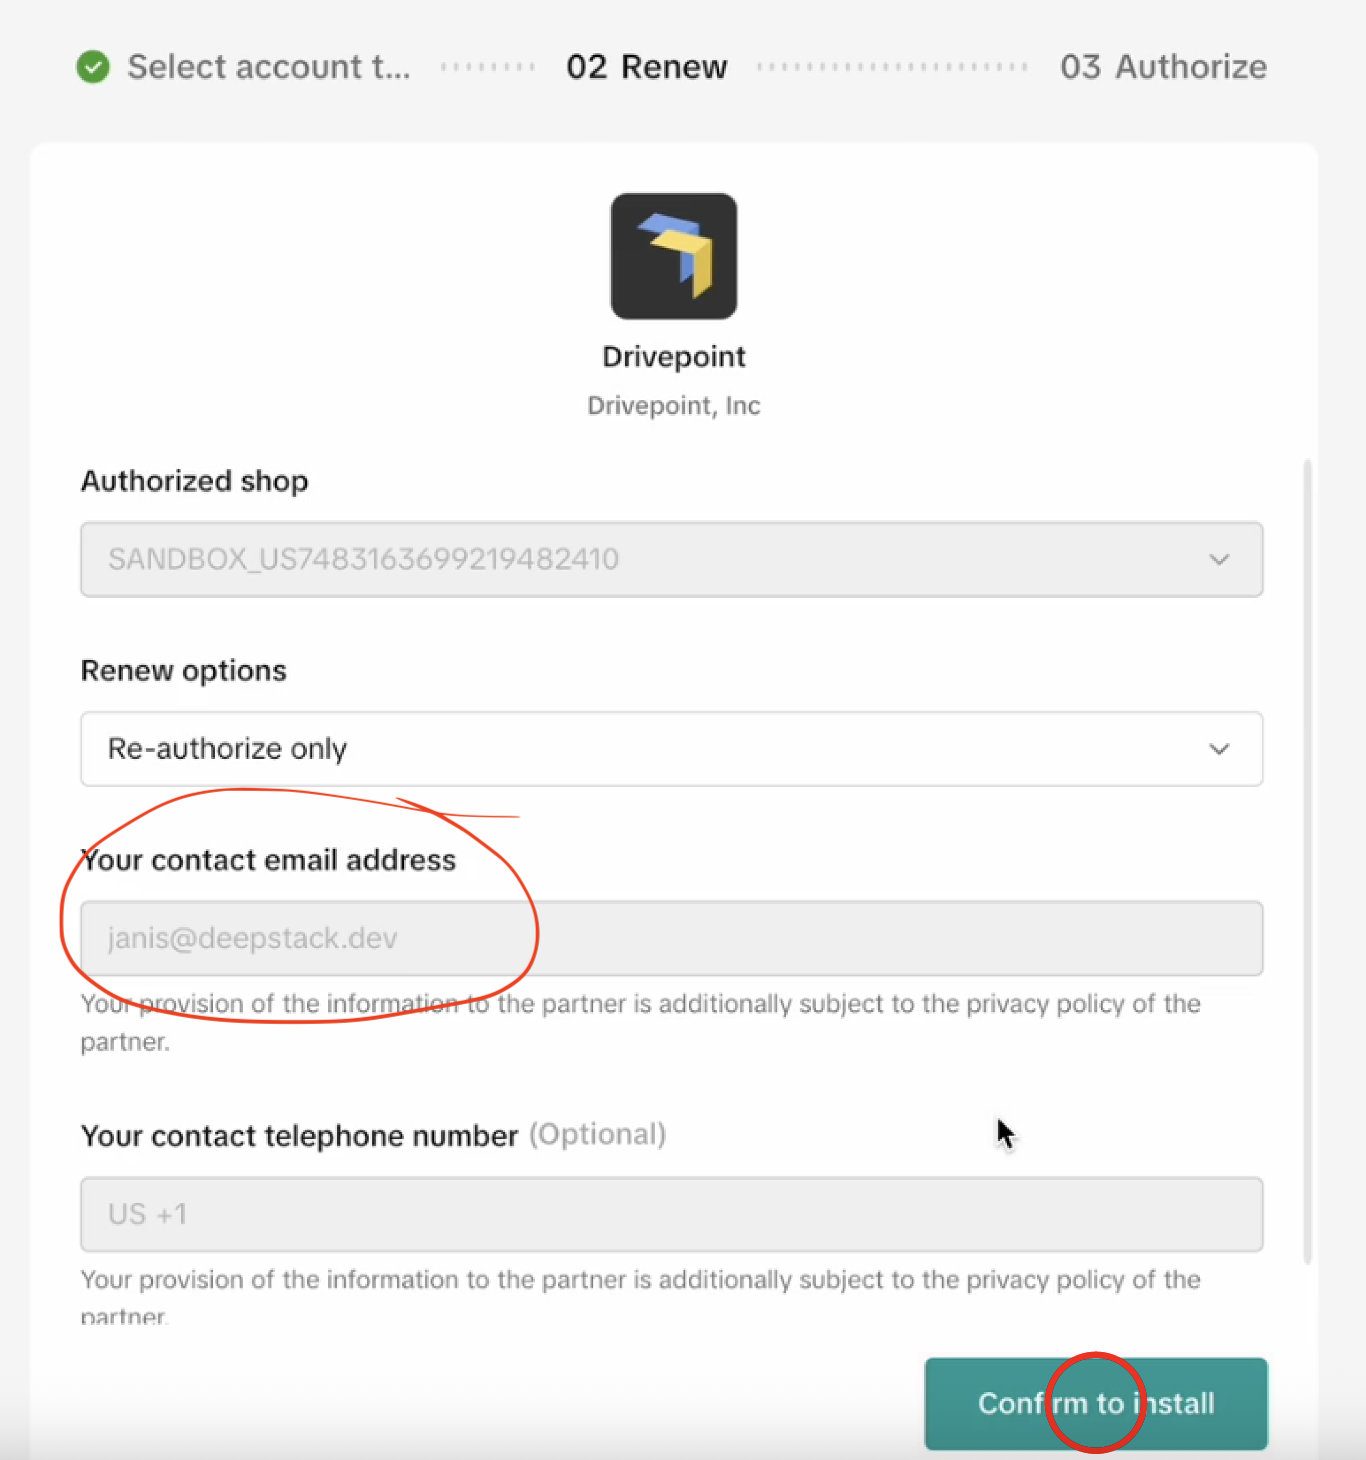
3. Click on the TikTok Shop logo
4. Add the TikTok Shop ADMIN's Email Address
   1. *This is important -> has to be the TikTok Shop Admin's email address*

<figure><img src="https://2089194542-files.gitbook.io/~/files/v0/b/gitbook-x-prod.appspot.com/o/spaces%2FuPhWdKX288WBK7UyaQZw%2Fuploads%2FtiUPKROgSWTYwshxblDW%2Fimage.png?alt=media&amp;token=86067dcf-5ab6-4f12-a31f-c8913309b70c" alt="" width="375"><figcaption></figcaption></figure>

1. Click "Confirm to Install"
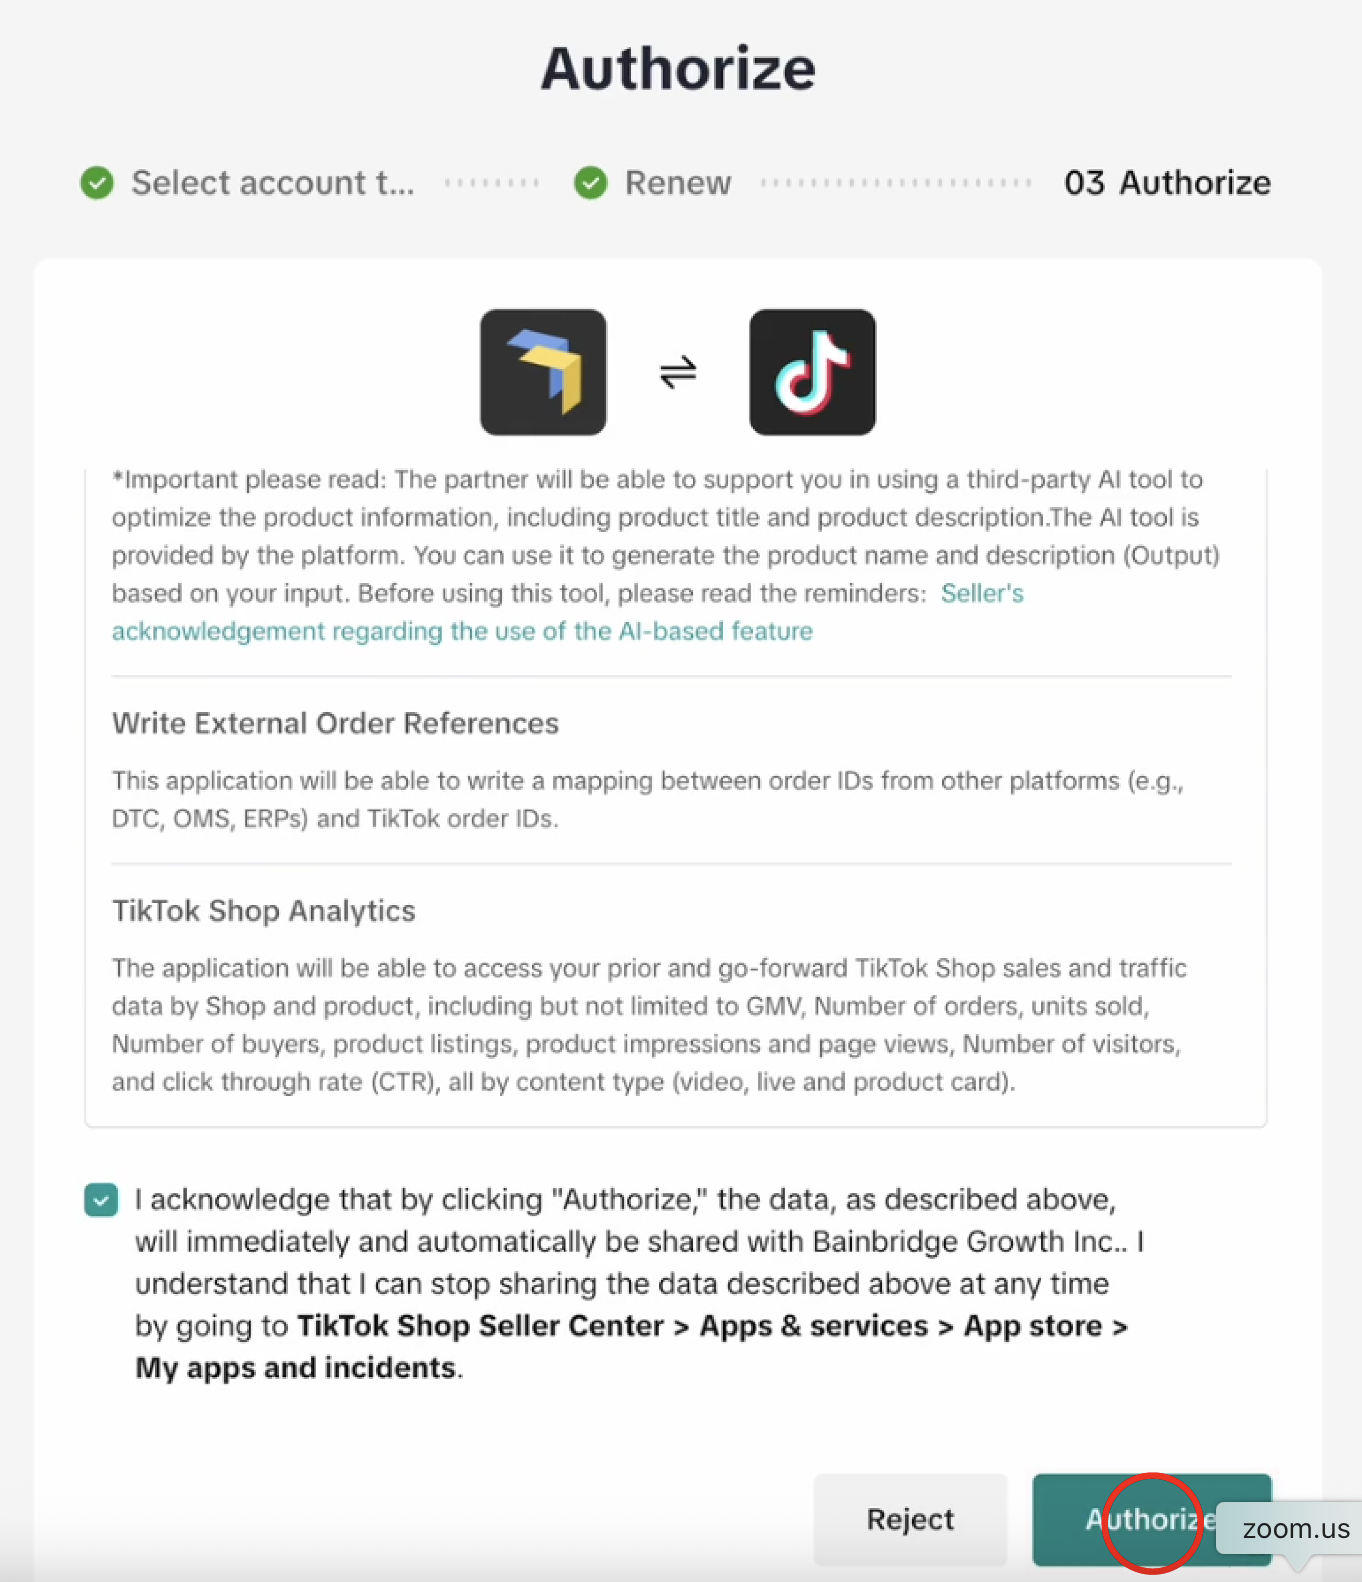
2. Check the "Terms and Conditions" box on the next page
3. Click "Authorize"

<figure><img src="https://2089194542-files.gitbook.io/~/files/v0/b/gitbook-x-prod.appspot.com/o/spaces%2FuPhWdKX288WBK7UyaQZw%2Fuploads%2F3SGSJenj1bjjXAuT8CIx%2Fimage.png?alt=media&amp;token=ed562fc6-d4a7-4455-97e1-36028e170b21" alt="" width="375"><figcaption></figcaption></figure>

1. Wait a minute or two, it takes a little while until TikTok Shop completes the auth
2. Back in the Drivepoint interface, **select your store!**
   1. *You need to do this for every store you would like to connect to Drivepoint. We do not have a multi-store support at the moment*

<figure><img src="https://2089194542-files.gitbook.io/~/files/v0/b/gitbook-x-prod.appspot.com/o/spaces%2FuPhWdKX288WBK7UyaQZw%2Fuploads%2FDrSkJD2d9118w4gPKWkK%2Fimage.png?alt=media&amp;token=f4660a4c-be66-4845-b961-2486e43113d0" alt="" width="188"><figcaption></figcaption></figure>

1. Click **"Connect Shop"**
2. You should see a **"You successfully connected TikTok Shop"**, if you don't reach out to us below:

{% content-ref url="/spaces/GWP01Uan8w7wePRkCAQS/pages/JIL9p5hP3IZ9pTXZcuqP" %}
[Contact Us](/help-1)
{% endcontent-ref %}


# Cin7

Learn how to connect your Cin 7 account to Drivepoint

## Cin 7 Omni

{% embed url="<https://www.loom.com/share/5614884fed9e45d2a08471e9d2e25b34?sid=3271ce7a-b62b-4062-938f-81d1ac4af5ae>" %}

1. Open Cin 7&#x20;
2. Navigate to Settings > Integrations > Api v1
3. **Copy your Account ID / API Username** *(separete from the APIs itself)*
4. Create a new API instance&#x20;
5. Set the permissions to "Full Control"
6. Click Create
7. **Copy the API Key**

**OR follow the official Cin 7 Omni API Documentation**

{% embed url="<https://help.omni.cin7.com/hc/en-us/articles/10015165519503-Set-up-a-Cin7-Omni-API-connection>" %}

## Cin 7 Core

1. Navigate to the External API website inside Cin 7 Core. [Here](https://inventory.dearsystems.com/ExternalAPI.) is the link.&#x20;
2. Click on the + to create a new connection
3. Name your connection "Drivepoint"
4. Screenshot the pop-up that will appear after you click create (this will give us the **API Key**)
5. Close the pop-up
6. Open the new Drivepoint listing again and screenshot the **Account ID** (see example as well)
7. Send Drivepoint the two screenshots

<figure><img src="https://2089194542-files.gitbook.io/~/files/v0/b/gitbook-x-prod.appspot.com/o/spaces%2FuPhWdKX288WBK7UyaQZw%2Fuploads%2FDWZDvgp6Z4t3LKijP0b7%2Fimage.png?alt=media&amp;token=b14737ab-6b8d-4f40-8408-c9602df080b7" alt=""><figcaption><p>Example of pop-up within Cin 7 Core API setup</p></figcaption></figure>


# How do I know if my data is accurate?

Find tips & tricks of how to verify that Drivepoint pulled your data accurately.

## Quickbooks

1. Reconcile to Quickbooks on the import (calculate net income) and compare to net income
2. Go to Quickbooks and confirm the import
3. Check live on the M-Monthly tab in the SmartModel™ as indicators *(performed on a monthly basis)*

<figure><img src="https://2089194542-files.gitbook.io/~/files/v0/b/gitbook-x-prod.appspot.com/o/spaces%2FuPhWdKX288WBK7UyaQZw%2Fuploads%2FPZkJvIKZvdc38aYiWcOC%2Fimage.png?alt=media&amp;token=9bb23e19-d458-473b-b026-07435f786208" alt=""><figcaption><p>The green rows indicate that there are no issues and everything matches QBO.</p></figcaption></figure>

4. Data "Freshest Data Available" shows when data was pulled in the warehouse and can be imported in the SmartModel™.&#x20;

<figure><img src="https://2089194542-files.gitbook.io/~/files/v0/b/gitbook-x-prod.appspot.com/o/spaces%2FuPhWdKX288WBK7UyaQZw%2Fuploads%2FH1z1sES16BWo0hcJ9T74%2Fimage.png?alt=media&amp;token=e192baf5-edba-4237-a152-a31d88e41413" alt=""><figcaption><p>Example: Latest data for QBO that can be imported into the SmartModel is from June 18th, 4am EST</p></figcaption></figure>

## Shopify

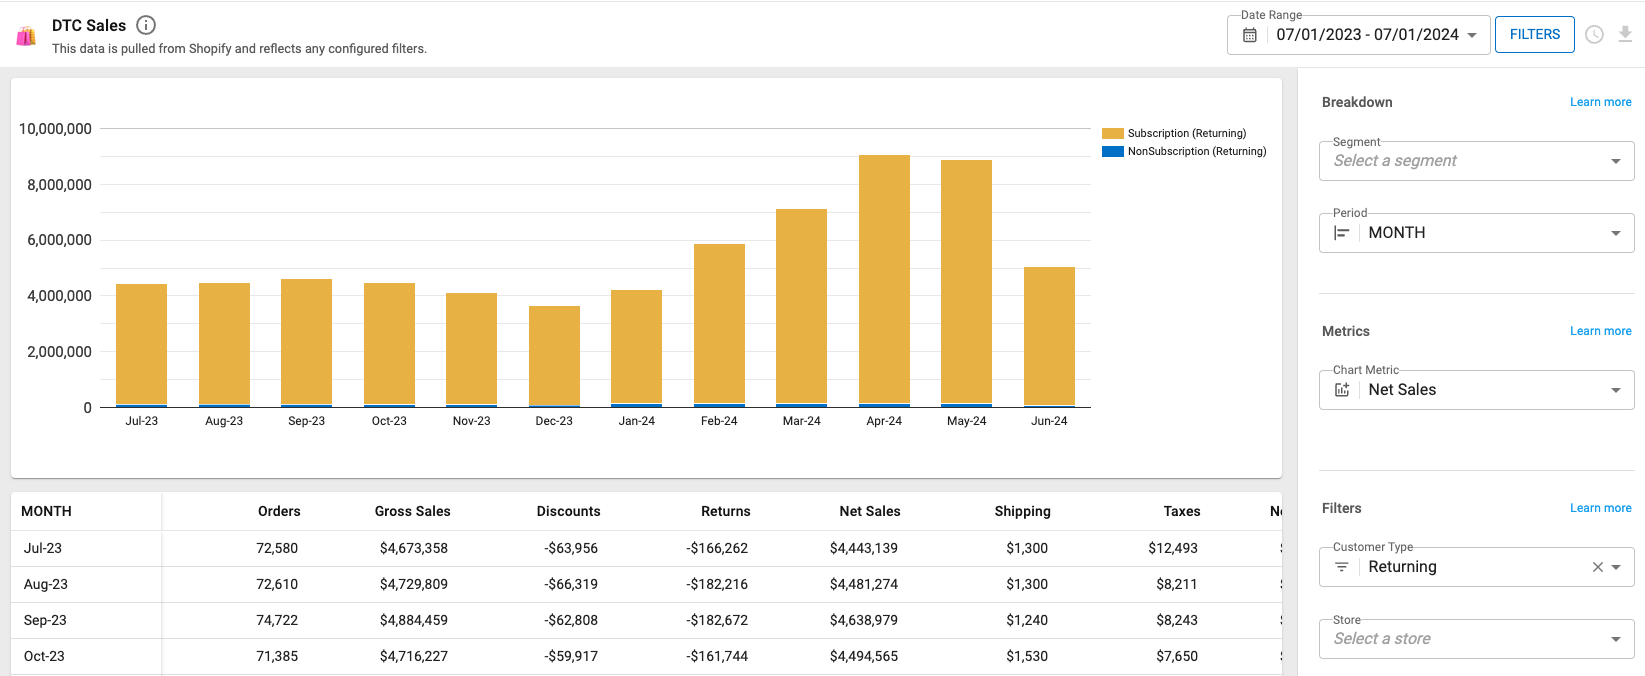
1. Navigate to the Shopify [Analytics](https://admin.shopify.com/dashboards) Dashboards
2. Add the desired time frame and metric
3. Compare the Shopify Sales performace to Drivepoint Shopify reports&#x20;

<figure><img src="https://2089194542-files.gitbook.io/~/files/v0/b/gitbook-x-prod.appspot.com/o/spaces%2FuPhWdKX288WBK7UyaQZw%2Fuploads%2FcK3mmrfGRuzIl83f1Mu5%2Fimage.png?alt=media&amp;token=e3af85cd-a9f2-4398-9b6e-7e833e7d9b7e" alt=""><figcaption><p>Drivepoint > Reports > DTC Sales</p></figcaption></figure>

## Amazon

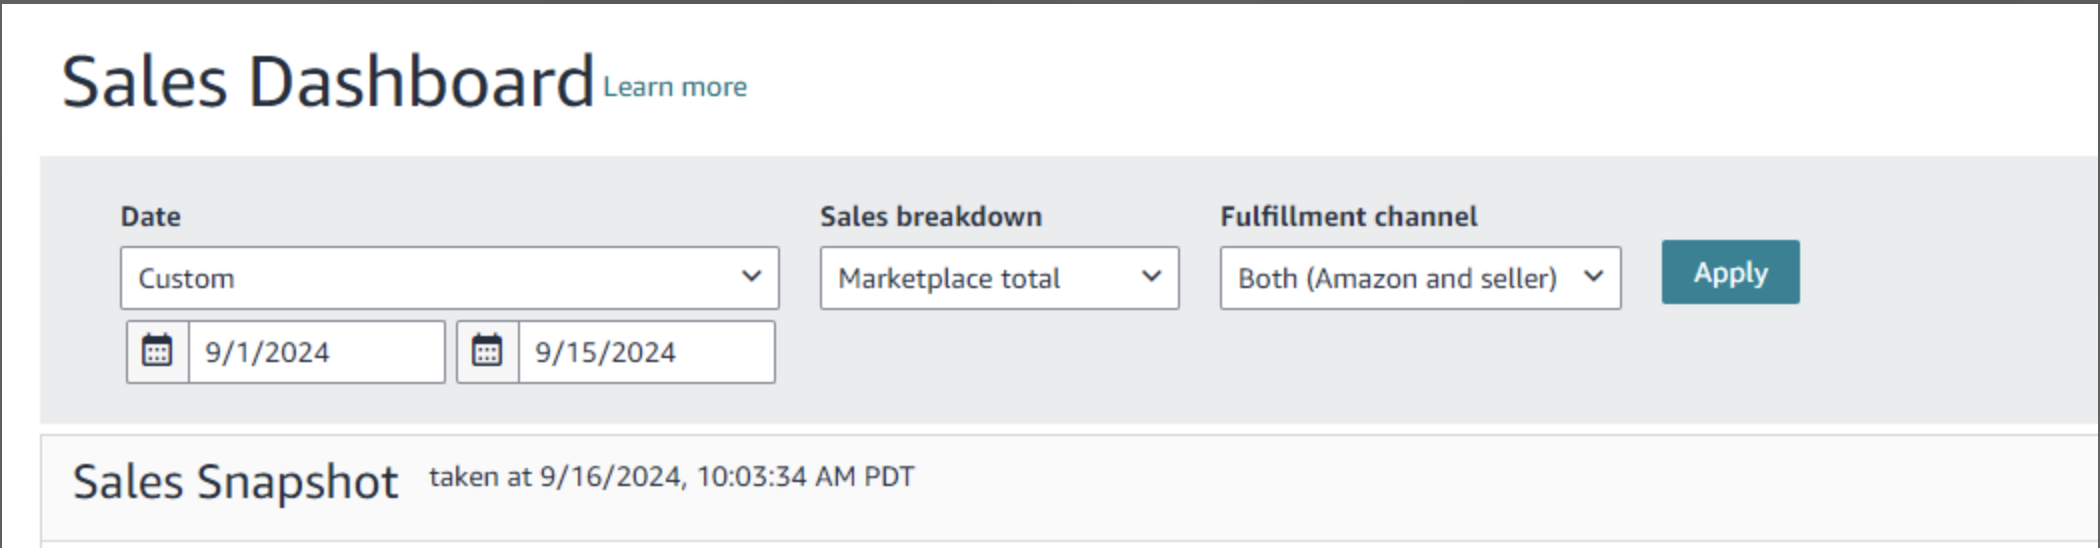
1. Navigate to the Amazon Sales Dashboard
2. Add the desired time frame, sales breakdown and fulfillment channel

<figure><img src="https://2089194542-files.gitbook.io/~/files/v0/b/gitbook-x-prod.appspot.com/o/spaces%2FuPhWdKX288WBK7UyaQZw%2Fuploads%2FEk4k5nThzpXakeI6OHYI%2Fimage.png?alt=media&amp;token=a8d0bb60-26ab-4385-b3e5-a6c27d783d20" alt=""><figcaption><p>Sales Dashboard within Amazon Seller Central</p></figcaption></figure>

3. Compare the Amazon Sales dashboards to Drivepoint Amazon reports

<figure><img src="https://2089194542-files.gitbook.io/~/files/v0/b/gitbook-x-prod.appspot.com/o/spaces%2FuPhWdKX288WBK7UyaQZw%2Fuploads%2F1YIVZr4O3eokq8FXDDzR%2Fimage.png?alt=media&amp;token=91707dff-6447-405b-9976-1e0dcbf8e12f" alt=""><figcaption><p>Drivepoint > Reports > Amazon Sales</p></figcaption></figure>

*We are working on a fix to ensure all Amazon data is always up to date, however we encountered that there sometimes might be a 14-Day time lag for Amazon Sales data. Learn more by clicking on Amazon reports below.*

{% content-ref url="/spaces/ePRvSjErXFousUDSWAz7/pages/N9BKbfVSxVucmF4yc5IK" %}
[Amazon Reports](/using-the-web-app/reports/amazon-reports)
{% endcontent-ref %}

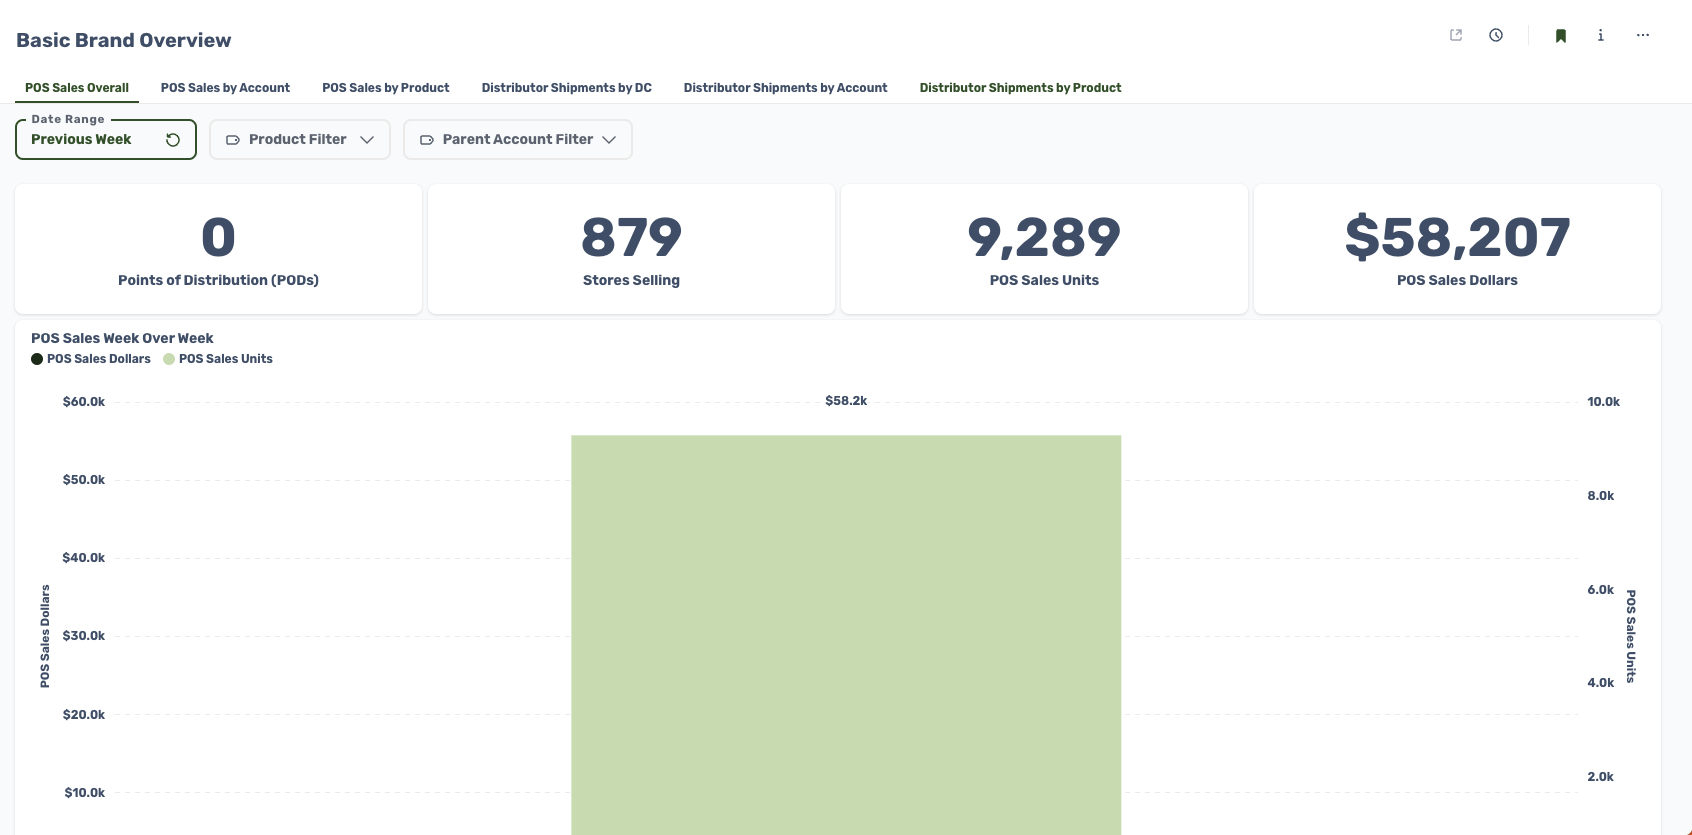
## Muffin Data

1. Navigate to the Muffin Data [Dashboard](https://analytics.muffindata.com/)
2. Select the desired time frame and metric

<figure><img src="https://2089194542-files.gitbook.io/~/files/v0/b/gitbook-x-prod.appspot.com/o/spaces%2FuPhWdKX288WBK7UyaQZw%2Fuploads%2FdO3RRtjqGAF0ZzhvbLIa%2Fimage.png?alt=media&amp;token=9c281856-1293-4e71-878a-d1472acd2b22" alt=""><figcaption><p>Muffin Data Dashboard</p></figcaption></figure>

3. Double check the numbers in the R-Wholesale tabs in the SmartModel™

<figure><img src="https://2089194542-files.gitbook.io/~/files/v0/b/gitbook-x-prod.appspot.com/o/spaces%2FuPhWdKX288WBK7UyaQZw%2Fuploads%2FY9l3j2KKcLCTxI2ZX9oV%2Fimage.png?alt=media&amp;token=5ae72ce4-3f3a-41eb-b16f-f47c6c81c48a" alt=""><figcaption><p>R-Wholesale by PRA / Product / PRA Product</p></figcaption></figure>


# Retail Data

See how your products sell through your retail partners: sales, inventory and availability, and shipments, all in one place.

Retail Data shows how your products sell **through** your retail partners' stores, places like Sephora, Ulta, Kohl's, Walmart, Target, and grocery and mass chains. It is separate from your own D2C site. It answers the questions you can't see from your own orders: how fast a product is selling at each retailer, whether stores are stocked, and how shipments into those retailers compare to what's actually selling.

## What you can do with it

* Track sell-through (units and dollars) by retailer and, where reported, by individual store.
* Spot out-of-stocks and low-stock stores before they cost you sales.
* Compare what you shipped in against what sold through, so you can see where inventory is piling up or running thin.
* Report on any retail calendar your partners use, without rebuilding the numbers by hand.

## What it covers

Retail Data is organized into three areas:

| Area                         | What it answers                                                           | Page                                                                                  |
| ---------------------------- | ------------------------------------------------------------------------- | ------------------------------------------------------------------------------------- |
| **Sell-through**             | How much sold to shoppers, at what price, and at what margin              | [Sell-through](/data-integrations/retail-data/sell-through)                           |
| **Inventory & availability** | What's on hand, on order, and in transit, and how many stores are stocked | [Inventory & availability](/data-integrations/retail-data/inventory-and-availability) |
| **Shipments**                | What you ordered, shipped, and the retailer received (sell-in)            | [Shipments](/data-integrations/retail-data/shipments)                                 |

{% hint style="info" %}
**Sell-through vs. shipments.** Sell-through is what shoppers bought off the shelf. Shipments (sell-in) are what moved into the retailer. They rarely match in a given week, and the gap between them is inventory sitting in stores and warehouses.
{% endhint %}

## Time periods and calendars

Every area is available at three time grains, so you can zoom from a single day out to a full month:

| Grain       | Details                                                 |
| ----------- | ------------------------------------------------------- |
| **Daily**   | The finest view, where a retailer reports at that level |
| **Weekly**  | Saturday week-ending                                    |
| **Monthly** | Exact calendar month                                    |

You can also slice the same numbers by the retail calendar your partners plan against: standard **calendar month**, the **NRF 4-5-4 retail calendar**, or **Walmart weeks**.

## Retailer vs. store detail

Retail Data comes at two levels of detail:

* **By retailer (banner):** one line per retailer, for every partner. Example: all of Sephora.
* **By store/location:** broken out to the individual store, available **where the retailer reports store-level data**.

## Getting connected

Retail Data populates once a retailer is connected. Connecting a retailer requires the **Wholesale Add-On**. For the list of supported retailers and step-by-step setup, see [Retailer Integrations](/data-integrations/retailer-integrations). To work with the data directly in the warehouse, see [BigQuery](/data-integrations/bigquery).

{% hint style="warning" %}
**Some metrics depend on the retailer.** Retailers report different things. When a partner doesn't send a metric, it comes through blank, never estimated or filled in. If a column looks empty for one retailer, it usually means that retailer doesn't report it.
{% endhint %}


# Sell-through

Units and dollars sold through to shoppers at each retailer, with price and margin detail.

Sell-through is what shoppers actually bought off the shelf at each retailer. It's the clearest read on real demand for your products in wholesale, retailer by retailer and, where reported, store by store.

**Use it to:**

* See which products and retailers are selling fastest.
* Measure the impact of a promotion by comparing regular, promo, and clearance sales.
* Track returns and net sales, not just gross.
* Watch margin on retail sales, not only revenue.

## Sales metrics

| Metric                          | What it tells you                                         | Notes                                   |
| ------------------------------- | --------------------------------------------------------- | --------------------------------------- |
| **Units sold**                  | Units sold through to shoppers, your core velocity number | Daily, weekly, and monthly              |
| **Gross sales**                 | Sales dollars before discounts and returns                | Reported by most retailers              |
| **Net sales**                   | Sales dollars after discounts and returns                 | Only where the retailer reports net     |
| **Regular sales (units & $)**   | Sold at full, non-promo price                             | Where the retailer splits by price type |
| **Promo sales (units & $)**     | Sold on promotion                                         | Where the retailer splits by price type |
| **Clearance sales (units & $)** | Sold on clearance or markdown                             | Where the retailer splits by price type |
| **Returns (units & $)**         | Units and dollars returned                                | Where the retailer reports returns      |

## Margin metrics

| Metric                        | What it tells you                   | Notes                                                       |
| ----------------------------- | ----------------------------------- | ----------------------------------------------------------- |
| **Gross margin**              | Margin dollars on what sold through | Also split by regular, promo, and clearance where available |
| **Cost of goods sold (COGS)** | Cost of the units that sold         | Also split by price type where available                    |

{% hint style="info" %}
**Retailer or store level.** Sell-through is available for every connected retailer at the banner level. Store-by-store sell-through is available where the retailer reports individual stores.
{% endhint %}

Retail forecasts a partner may share (planned sell-through, planned inbound) are kept separate from these actuals so they never mix into your reported numbers.


# Inventory & availability

What's on hand, on order, and in transit at each retailer, plus how many stores are stocked.

Inventory & availability shows what stock is sitting where across your retail partners, and how many of their stores actually have your product on the shelf. It's how you catch out-of-stocks and overstock before they show up in your sales.

**Use it to:**

* Find stores and retailers that are out of stock or running low.
* Track how much inventory is on hand, on order, and on its way.
* Estimate weeks of supply so you can flag reorder or overstock risk.
* Monitor how widely your product is stocked across a retailer's stores.

## Inventory position

| Metric                     | What it tells you                                       | Notes                                        |
| -------------------------- | ------------------------------------------------------- | -------------------------------------------- |
| **On hand (units & $)**    | Stock physically in stores and DCs at the snapshot      | Retail value; cost value also where reported |
| **On order (units & $)**   | Ordered by the retailer, not yet received               | Where the retailer reports it                |
| **In transit (units & $)** | On its way to the destination                           | Where the retailer reports it                |
| **Presentation minimum**   | The floor/shelf minimum before a store reads as low     | Where the retailer reports it                |
| **Weeks of supply**        | How long on-hand stock will last at recent sell-through | Derived from on-hand and recent units sold   |

## Store availability

| Metric                  | What it tells you                          | Notes                                            |
| ----------------------- | ------------------------------------------ | ------------------------------------------------ |
| **Stores carrying**     | Stores authorized to carry the item        | Where the retailer reports store counts          |
| **Stores in stock**     | Stores that currently have it on the shelf | Where the retailer reports store counts          |
| **Stores out of stock** | Stores that should carry it but are out    | Where the retailer reports store counts          |
| **In-stock rate**       | Share of carrying stores that are in stock | Derived from stores in stock and stores carrying |

{% hint style="info" %}
**Snapshots.** Inventory is a point-in-time snapshot for each period, so numbers show the stock position as of that week or month end, not a running total.
{% endhint %}

Inventory & availability is available for every connected retailer at the banner level. Store-by-store inventory is available where the retailer reports individual stores.


# Shipments

What you ordered, shipped, and the retailer received, the sell-in side of retail.

Shipments are the sell-in side of retail: what was ordered, what you shipped, and what the retailer received. Comparing this to sell-through tells you whether inventory is building up or drawing down at your partners.

**Use it to:**

* Reconcile orders, shipments, and receipts by retailer.
* Compare sell-in to sell-through to spot inventory building up or running short.
* Track shipment value alongside units and cases.

## Shipment metrics

| Metric                      | What it tells you                    | Notes                                        |
| --------------------------- | ------------------------------------ | -------------------------------------------- |
| **Ordered (units & cases)** | What the retailer ordered            | Where the retailer reports orders            |
| **Shipped (units & cases)** | What you shipped in                  | Cases where the retailer reports them        |
| **Shipped value ($)**       | Dollar value of what shipped         | Gross and net where reported                 |
| **Received (units & $)**    | What the retailer confirmed received | Retail value; cost value also where reported |

Shipments are tracked from origin to destination, so you can see where product was shipped from and which retailer location received it.

{% hint style="info" %}
**Why sell-in and sell-through differ.** In any given week, what ships into a retailer rarely equals what sells through to shoppers. The difference is inventory. Watching the two together is the fastest way to catch a partner over- or under-stocking.
{% endhint %}


# Overview of the SmartModel™️

Start using the SmartModel™ right away with a quick crash course.

{% embed url="<https://drive.google.com/file/d/1hF1pCdNwWyHDMNhwWPqeDwyDC8F7kMIz/view>" %}
Understand how to navigate the SmartModel and what the different tabs mean!
{% endembed %}

### **How to open your SmartModel™️ :**

1. Navigate to the [Drivepoint platform](https://app.drivepoint.io/)
2. Click on "SmartModel™️" on the left navigation menu

### What makes a SmartModel™ a SmartModel™?

In order to have the Excel files powered with our technology we have the following tabs integrated in a SmartModel™:&#x20;

1. **Settings tab**: identifies the ID of the company that gets picked up by the Drivepoint Data Warehouse.
2. **M-Monthly tab**: the "spine" of our model that informs all of the financial and variance reports in the Drivepoint Web-App.
3. **Ranges tab**: this provides the structure to the Drivepoint technology and it's essential that it is well formatted.&#x20;

*P.S. the file also needs to be in the Excel format (xlxs, xlsm).*

The Drivepoint team sets you up with these core tabs so that you are able to make use of the entire suite of product offerings. If you ever happen to accidentally delete something or core features are not working, please do not hesitate to reach out to us. <br>


# SmartModel Best Practices

How to best work in the SmartModel™ (without breaking anything!)

Excel is a magical tool in part because of its immense flexibility. But to preserve your sanity and allow a machine (the Drivepoint Add-In) to work properly, there are a few restrictions that have to been enforced:

1. **Don't Delete Rows, Columns or Tabs.**  In general, don't delete rows or columns in your model. If you really don't want to see something, use the native Excel options to **Group** or **Hide** rows or columns instead. Avoid deleting tabs unless you created them and know for certain they're not "wired" into the model in some way (e.g. if you created a quick scratch tab).&#x20;
2. **Don't Insert New Columns.**  Adding columns is a no-no, since the model and Add-In expect certain data to appear in certain specific columns. Column structure is protected by default to help make sure this doesn't happen by accident. If you need to insert columns for a specific reason, please contact us for support and we're happy to help find a solution.
3. **Column B is for Drivepoint.** Our add-in uses Column B to read your model and move the right data in and out of your sheets. Don't manipulate the data in this column unless you know exactly what you're doing.&#x20;

And so you don't think it's all doom and gloom, the following operations are totally safe:

1. **Add (Whole) Rows Wherever You Want.** You can add whole rows to create calculations and notes without fear. Adding rows is almost guaranteed to be a safe operation. Go for it!&#x20;
2. **Add Any Tabs Any Time.** Add tabs to your heart's content for scratch calculations or quick schedules. If you're building a more permanent schedule or something you'd like to integrate with the Drivepoint system, your sheet will need to adhere to the Drivepoint schedule spec and be registered with the model - just give us a shout and we're happy to help with this.

{% hint style="success" %}
**Hit us up!** When in doubt about any operation in the model, just ask! Slack your account rep or email us via <help@drivepoint.io>.
{% endhint %}


# Video Training - Q\&A

Join us as we are discussing an internal informal discussion on how to edit the SmartModel™ on a variety of use cases.

{% embed url="<https://www.loom.com/share/a607a924614f496393905d0d4820d9ba>" %}
Expand the boxes below to view the outline of the video
{% endembed %}

## Outline: Use Cases + Questions We Will Answer

<details>

<summary>"Live Model" and Working in Excel</summary>

* What does the notion of live model mean? (min 0:39)
* My formulas are not calculating how do I fix that? (min 5:52)

</details>

<details>

<summary>Marketing Scenarios + CAC + New Ad Sources</summary>

* How do I override my forecast for an existing ad source? (min 1:34)
* How do I add a new ad source? (min 3:00)
* How do I adjust my CAC? (min 6:45)&#x20;
* How should I think about CAC across channels even though Drivepoint only asks for a blended CAC? (min 7:20)
* How should I think about how a new ad source influences my CAC? (min 8:15)

</details>

<details>

<summary>Checking my Work by Utilizing Drivepoint Templates</summary>

* How can I check the Marketing changes that I made and which templates are the most useful? (min 9:15)
* How do I compare against a base plan? (min 10:35)

</details>

<details>

<summary>Adding new Wholesale/Retail Accounts</summary>

* How do I add a new account/chain that I am starting to sell in? (min 12:57)
* How do I name my Wholesale tabs correctly? (min 14:56)

</details>

<details>

<summary>Adding New SKUs + Changing my Sales Mix</summary>

* How do I add a new SKU (min 19:09)?
* How should I think about import shipping? (min 19:31)
* How should I think about landed unit costs? (min 19:53)
* How do I change my sales mix? (min 21:10)
* How should I indicate cannibalization of Sales by product with new product launches? (min 21:43)
* How do I change my channel pricing? (min 21:58)
* Is there an easy shortcut to&#x20;

</details>

<details>

<summary>Other Tips</summary>

* As you are building scenarios, go big in your assumptions so that you can truly see the impact of the scenario. Instead of $4000 for Bing Ads, go for $400,000 in Bing Ads.
* If your product sales mix + pricing is generally pretty stable, we have a shortcut for assuming product information. (min 22:04)

</details>


# Add Key Drivers and Results

Customize what the Scenario Agent knows about your model by adding Key Drivers + Results in any Drivepoint Plan.

## How do I add Key Drivers + Results?

{% embed url="<https://youtu.be/IGOWm4xadNo>" %}

### Step by Step process

1. Right click anywhere in the row or highlight multiple rows *(multi-select works!)*
2. Hover over "Drivepoint"
3. Select: "Enable Key Driver/Result"
4. Wait a few minutes and view your results in Quick Edit & the Agent *(should be 2min or less!)*

## **✨ New Key Drivers and Results tab**

A new standardized tab called "Key Drivers + Results" is being added to all customer SmartModels™. This tab consolidates all key drivers (like DTC AOV, conversion rates, marketing spend) and key results (P\&L outputs, metrics) in one central, locked tab.

Previously, key drivers were hardcoded in the app; now they're stored directly in the model, giving customers the ability to self-serve and curate which drivers appear in Quick Edit and the Agent.

#### Format Requirements

For the Key Drivers + Results tab to be valid and processed correctly by Drivepoint, the following format rules must be met:

**Header rows (Row 2 and Row 3)**

* Cell **C2** must contain the value: `End of Period`
* Cell **C3** must contain the value: `Period Type`

**Date columns (starting at column K)**

* **K2 and all subsequent date columns in Row 2** must contain a valid date that falls on either the **last day of the month** (e.g., `1/31/2025`) or the **1st of the month** (e.g., `1/1/2025`)
* **K3 and all subsequent date columns in Row 3** must contain either `Forecast` or `Actual`

> ⚠️ If any of these requirements are not met, the tab will fail validation and Drivepoint will not be able to process it. Double-check these cells before saving your model.


# Basics

The Drivepoint SmartModel™ is a connected financial model that you can use to create financial plans for your business. It is connected to your Drivepoint data warehouse and your dashboards using the

## In this article, we'll explain:

1. [​How to access the model](#how-to-access-the-model)​
2. [​The anatomy of the model](#anatomy-of-the-model)​
3. [​Using the Drivepoint Excel Add-In​](/getting-started/installing-the-drivepoint-add-in)
4. ​[Working in the model with others](#working-with-others-in-excel-online)​
5. [​](#working-in-desktop-versions-of-excel)[Working in desktop versions of Excel​](#working-in-desktop-versions-of-excel)

### How to Access the Model <a href="#how-to-access-the-model" id="how-to-access-the-model"></a>

You should always access the model through the Drivepoint web application. This ensures you're always seeing the most up to date version and eliminates any issues with version control.

1. **Log in** to your [Drivepoint homepage](https://app.drivepoint.io/) at app.drivepoint.io
2. Using the left-hand navigation panel, click on the **SmartModel™️** option
3. The model will open a new tab
4. If necessary, you may be prompted to log in to your Microsoft account.

### Using the Drivepoint Excel Add-In

The Drivepoint Excel Add-In connects your model to the Drivepoint platform, allowing you to import data from your key sources and save your model output back to your cloud data warehouse, so it can be used in dashboards, scorecards and other reports.&#x20;

**Step 1**: The first time you open your model, you'll be prompted to authorize the Add-In. Choose the option to **Trust this add-in**

{% hint style="info" %}
If you don't see the prompt, see [Installing the Drivepoint Add-In](/getting-started/installing-the-drivepoint-add-in).
{% endhint %}

**Step 2:** Once installed, click the blue Login button, and enter your email and password (the same credentials you used to access the web application).

That's it🚀!  Your model is now connected to the Drivepoint data system, so you can import your latest data and save unlimited scenarios to the cloud.

### Working with others in Excel online

One the very best features of the SmartModel™️ is the ability to work collaboratively in the model with your colleagues and your Drivepoint team. This is primary reason why we host the model online. It allows you to:

1. Work with your colleagues in the same model, reducing version control errors and preventing bottlenecks created by "model czars."
2. Get support and assistance immediately, without having to send files back and forth
3. Automatically receive new improvements, schedules, and views to the model so you get more and more value over time

When you work with with others in the model, you can see them moving around in the main grid area, just like in Google Sheets.  You'll also see an avatar with the person's initials in the top right hand corner of the Excel window. If they're working in another tab from the one you're in, you can click on their avatar see where they are and select "Go to Location" to jump directly there.&#x20;

### Working in desktop versions of Excel

{% hint style="warning" %}
**We strongly recommend working with the SmartModel in Excel online except in rare circumstances.** Working with the SmartModel in desktop versions of Excel can create merge conflicts that <mark style="color:orange;">may result in a loss of your work</mark> and/or limit our ability to properly support your model. This should be considered an "expert-only" feature.&#x20;
{% endhint %}

Certain users may prefer to work in the Excel desktop applications for Mac or PC. This is 100% possible in the SmartModel, and because the model is hosted on SharePoint, you can still work collaboratively with other users, even if they are using Excel on the web.&#x20;

**To open the model in desktop Excel:**

1. Open the model in Excel online.&#x20;
2. In the top right hand area of the Excel toolbar, click on the **Editing** menu and choose the **Open in Desktop App** option.&#x20;
3. Once the model has opened in the desktop application, close the original browswer tab to prevent confusion.
4. Make your desired changes
5. Close the Excel application when complete.

When working this way, it's much more likely that Excel will encounter "merge conflicts" that can create a version control nightmare and may require support to resolve. We strongly encourage you to use Excel online unless you're absolutely certain you need desktop Excel to perform a specific function.&#x20;


# Layout and Navigation

The model consists of a set of tabs (sometimes called sheets) that work together to create the model's output and provide various ways to read and work with that output.

#### In this article, we'll explain:

1. [The three main types of tabs](#tab-types)
2. [The basic layout and logic flow of the tabs](#tab-layout-and-logic-flow)
3. [How to navigate between tabs](#navigating-between-tabs)

### Tab Types

The contains three primary kinds of tabs that work together to create the model's output and provide various ways to read and worth with model output.&#x20;

<table data-view="cards"><thead><tr><th></th><th></th><th></th></tr></thead><tbody><tr><td></td><td><mark style="color:blue;"><strong>Reports</strong></mark></td><td>Reports are tabs that present the output of your model. </td></tr><tr><td></td><td><mark style="color:yellow;"><strong>Schedules</strong></mark></td><td>Schedules include inputs and are how the model calculates its outputs.</td></tr><tr><td></td><td><strong>Data Tabs</strong></td><td>Data tabs contain data tables that are used to drive your schedules.</td></tr></tbody></table>

{% hint style="info" %}
:point\_up:**Quick Tip:** Tabs are color-coded by convention to help you quickly orient yourself when working in the model.&#x20;

**Report** tabs are <mark style="color:blue;">**BLUE**</mark>

**Schedule** tabs are <mark style="color:yellow;">**GOLD**</mark>

**Data** tabs are **GREY**&#x20;
{% endhint %}

### Tab Layout and Logic Flow

By default, the tabs are laid out from left to right starting with <mark style="color:blue;">**Reports,**</mark> then <mark style="color:yellow;">**Schedules,**</mark> then **Data Tabs.**  This is intended to make it easy for a non-modeler to understand and work with the output of the model, will revealing complexity and functionality as you move across the tabs to the right.

<figure><img src="https://2524697288-files.gitbook.io/~/files/v0/b/gitbook-x-prod.appspot.com/o/spaces%2FrQPOpSFypZMSNdEbaKKD%2Fuploads%2FhpDWaXK2jM03tOdl4wc4%2FScreenshot%201%20for%20Layout%20of%20the%20Model.png?alt=media&amp;token=62311eb6-747a-427e-b3e8-4f06b4445ef0" alt=""><figcaption></figcaption></figure>

The logic flow of the model moves in the **opposite** direction, meaning that the most detailed user inputs happen in tabs to the right, and are used in shedules and reports that "flow" into tabs on the left.&#x20;

As an example, let's look at how the model forecasts orders for the DTC channel:&#x20;

<figure><img src="https://2524697288-files.gitbook.io/~/files/v0/b/gitbook-x-prod.appspot.com/o/spaces%2FrQPOpSFypZMSNdEbaKKD%2Fuploads%2FdKacHdT0D3NklzkgWLeU%2FScreenshot%202%20for%20layout%20of%20the%20model.png?alt=media&amp;token=b0422480-a6aa-4ab5-8f79-b665ee5da420" alt=""><figcaption></figcaption></figure>

{% hint style="info" %}

### All roads lead to M-Monthly.

The out schedules are consolidated together to form your forward-looking financial statements in the M-Monthly tab. In this tab, you'll find a complete register of your Income Statement, Balance Sheet, Cash Flow Statement, and a number of financial and operational metrics.&#x20;

For the most part, your Reports will be referencing data on this tab, so if you ever need to de-bug or investigate where a number in your reports is coming from, this is a good place to start. As we like to say, "all roads lead to M-Monthly."
{% endhint %}

### Navigating between tabs


# DTC

Forecast your DTC Schedule utilizing the video guide below.

### Quick Links

{% content-ref url="/pages/SSPRKQfUh0Efkfvn6YP8" %}
[Broken mention](broken://pages/SSPRKQfUh0Efkfvn6YP8)
{% endcontent-ref %}

{% content-ref url="/pages/ti0zK2iYq0vWp6HTUdDu" %}
[Broken mention](broken://pages/ti0zK2iYq0vWp6HTUdDu)
{% endcontent-ref %}

### Video Outline

1. An overview of the DTC Schedule
2. How to forecast revenue in the DTC channel by segment (e.g. Subscription vs. Non-Subscription)
3. How the Drivepoint SmartModel™ uses your historical data to forecast returning customer sales by cohort
4. How to forecast cost of goods, variable expenses, and marketing in the DTC channel

{% embed url="<https://www.youtube.com/watch?v=rGpoQAPs5p4>" %}


# DTC - Acquisition

Find below a KPI Glossary to fully understand the DTC - Acquisition Tab. Simply click into one of the expandable blocks to learn more👇

<details>

<summary>Blended Paid Customer Acquisition Cost (CAC) - Orders</summary>

Calculation: Direct Advertising Spend divided by First Time Customer Orders

Description: This represents the blended (average) cost to acquire a First Time Order into the business. This is used to gauge advertising spend efficiency and profitability on a more granular level. We can use this to view the cost of bringing on an “average order” during a specific time period. We can then track additional lifetime purchases of a cohort against this metric to determine if and when this cohort of orders are net profitable to the business (meaning they have paid back these direct advertising costs).

</details>

<details>

<summary>First-Time Customer Orders</summary>

Calculation: n/a

Description: First-Time Customer Orders here means all Shopify orders that are the first order for the customer regardless of their Shopify segment (Subscription, One-Time Purchase etc.) during the defined period (usually Month).

* First time represents that this is the first month the customer has purchased an order
* Note: if a customer purchases two orders in that same month they both will be considered first time as they are grouped within that first month.

</details>

<details>

<summary>First-Time Customers</summary>

Calculation: n/a

Definition: Similar to First-Time Customer Orders, *First-Time Customers* represent the number of unique customers that purchased an order in a given segment for the first time (regardless of Shopify segment such as subscription or one-time purchase) during the defined time period (usually Month).

* This will often be lower than First-Time Customer Orders as customers can order more than one order during the time period (either within the same segment or amongst multiple segments).
* Note: these customers may have ordered previously in other non-Shopify segments (such as Amazon or Wholesale) but for simplicity of attribution, those are excluded here.

</details>

<details>

<summary>First-Time Order to Customer Ratio</summary>

Calculation: First Time Customer Orders divided by First-Time Customers

Definition: This represents the ratio of first time customer orders to first time unique customers. This ratio can tend to be around a 1.0 but will vary based on frequency of ordering.

* For example, if customers tend to order more frequently than one per month, such as bi-weekly, this number will trend notably higher than 1.0.

</details>

<details>

<summary>Blended Paid CAC (Customers)</summary>

Calculation: Direct Advertising Spend Divided by First-Time Customers

Definition: Similar to the Blended CAC - Orders, this represents the blended (average) cost to acquire a First Time Customer into the business. This is used to gauge advertising spend efficiency and profitability on more of a customer basis. We can use this to view the cost of bringing on an “average customer” during a specific time period. We can then track the lifetime purchases of this cohort against this metric to determine if and when they are net profitable to the business after including those direct advertising expenses.

</details>


# DTC - One-Time Purchase (OTP)

Find below a KPI Glossary to fully understand the DTC - OTP Tab. Simply click into one of the expandable blocks to learn more👇

<details>

<summary>Blended Average Order Value</summary>

Calculation: Total Gross Sales divided by the Total Orders for the Period.

*💡 Total Orders Represents both First-Time and Returning customer orders.*

**Definition**: This approach represents, on average, how much a customer pays for an order in this segment on Shopify during the time period. This is a useful metric to start to understand overall unit economics to the business as well as a starting point for granular analysis into Customer Lifetime Value (LTV).

*💡 Since Gross Sales is used as an input here, this represents the average price paid for an order before any discounts, refunds, shipping income or Taxes.*

</details>

<details>

<summary>Orders (First Time)</summary>

**Calculation**: n/a

**Definition**: This represents all orders within the first month within the One-time (OTP) segment - meaning that these customers have no prior purchases in another month in either OTP or Sub segment within Shopify.

*💡 These could have been repeat purchasers from Wholesale or Amazon, but for simplicity of attribution, they are treated as first time in DTC.*

All orders in that first month within the segment are considered first-time, meaning there can be more than one order per one first-time customer

</details>

<details>

<summary>Orders (Returning)</summary>

**Calculation**: n/a

**Definition**: Similar to First-Time Orders, these represent returning customers in the OTP segment. These returning customers signify that Shopify has recorded at least one other purchase from this customer in the history of your store and this order took place not in the first month that the customer purchased.

</details>

<details>

<summary>AOV (Gross Sales Per Order) - First-Time</summary>

**Calculation**: Total Gross Sales from First-Time OTP orders in the period divided by Total First-Time Orders for the period.

**Definition**: This metric represents the average price paid per First-Time order in the OTP segment for the given period (e.g.,, month of July). Note: because this metric utilizes Gross Sales in its numerator, it represents the average price paid *before* any discounts, returns, refunds or taxes are considered.

</details>

<details>

<summary>AOV (Gross Sales Per Order) - Returning</summary>

**Calculation**: Total Gross Sales from Returning OTP orders in the period divided by Total Returning Orders for the period.

**Definition**: This metric represents the average price paid per Returning order in the OTP segment for the given period (e.g.,, month of July). Note: because this metric utilizes Gross Sales in its numerator, it represents the average price paid *before* any discounts, returns, refunds or taxes are considered.

</details>


# DTC - Subscription

Find below a KPI Glossary to fully understand the DTC - Subscription Tab. Simply click into one of the expandable blocks to learn more👇

<details>

<summary>Blended Average Order Value</summary>

Calculation: Total Gross Sales divided by the Total Orders for the Period.

*💡 Total Orders Represents both First-Time and Returning customer orders.*

**Definition**: This approach represents, on average, how much a customer pays for an order in this segment on Shopify during the time period. This is a useful metric to start to understand overall unit economics to the business as well as a starting point for granular analysis into Customer Lifetime Value (LTV).

*💡 Since Gross Sales is used as an input here, this represents the average price paid for an order before any discounts, refunds, shipping income or Taxes.*

</details>

<details>

<summary>Orders (First Time)</summary>

**Calculation**: n/a

**Definition**: This represents all orders within the first month within the One-time (OTP) segment - meaning that these customers have no prior purchases in another month in either OTP or Sub segment within Shopify.

*💡 These could have been repeat purchasers from Wholesale or Amazon, but for simplicity of attribution, they are treated as first time in DTC.*

All orders in that first month within the segment are considered first-time, meaning there can be more than one order per one first-time customer

</details>

<details>

<summary>Orders (Returning)</summary>

**Calculation**: n/a

**Definition**: Similar to First-Time Orders, these represent returning customers in the OTP segment. These returning customers signify that Shopify has recorded at least one other purchase from this customer in the history of your store and this order took place not in the first month that the customer purchased.

</details>

<details>

<summary>AOV (Gross Sales Per Order) - First-Time</summary>

**Calculation**: Total Gross Sales from First-Time OTP orders in the period divided by Total First-Time Orders for the period.

**Definition**: This metric represents the average price paid per First-Time order in the OTP segment for the given period (e.g.,, month of July). Note: because this metric utilizes Gross Sales in its numerator, it represents the average price paid *before* any discounts, returns, refunds or taxes are considered.

</details>

<details>

<summary>AOV (Gross Sales Per Order) - Returning</summary>

**Calculation**: Total Gross Sales from Returning OTP orders in the period divided by Total Returning Orders for the period.

**Definition**: This metric represents the average price paid per Returning order in the OTP segment for the given period (e.g.,, month of July). Note: because this metric utilizes Gross Sales in its numerator, it represents the average price paid *before* any discounts, returns, refunds or taxes are considered.

</details>


# AMZN

Forecast your Amazon channel P\&L using the Bainbridge SmartModel™

### **Overview & Revenue**

In this video, we cover:

1. An overview of the Amazon schedule
2. How to forecast revenue from Amazon using ad spend and a "halo effect" from other advertising

{% embed url="<https://youtu.be/Gq6M02ssPwg>" %}

### Part 2: Cost of Goods, Variable Costs and Other Marketing Expenses

In this video, we cover:&#x20;

1. Forecasting cost of goods sold on a unit basis
2. How to set the right assumptions for FBA fees and Amazon referral fees
3. Forecasting any additional marketing expenditures to get to contribution margin after marketing from the Amazon Channel

{% embed url="<https://youtu.be/OBLL0DKqw8k>" %}


# Wholesale

Forecast your Wholesale channel P\&L using the Drivepoint SmartModel™

### **Part 1: Overview & Revenue**

In this video, we cover:

1. An overview of the Wholesale schedule
2. How to forecast revenue by account in the Wholesale channel using a unit velocity approach
3. How to input assumptions for trade spend, early pay discounts, and other adjustments to revenue

{% embed url="<https://youtu.be/7amqblT7h4w>" %}

### Part 2: Cost of Goods, Variable Costs and Other Marketing Expenses

In this video, we cover:&#x20;

1. Forecasting cost of goods sold on a unit basis
2. Setting assumptions for any other variable costs of sales
3. Forecasting any additional marketing expenditures to capture profitability for each account

{% embed url="<https://youtu.be/UJee-aZqvDY>" %}


# Powered by Muffin Data

This page is for you, if you have native Wholesale integrations through the Muffin Data platform.

If you have purchased the Wholesale Add-On, we are standing up the following Wholesale Schedule with your data (pulled from Muffin Data) right in your SmartModel™.<br>

**Structure of the Wholesale Schedule that is powered by Muffin Data**

* [Profit and Loss Summary](#profit-and-loss-summary)
* [Sales Cash Flow Summary](#sales-cash-flow-summary)
* [Gross Sales by Account](#gross-sales-by-account)

**Let’s dive into each section and understand it in detail.**<br>

#### **Profit and Loss Summary**

This section provides a high level overview on the core financial metrics for your wholesale data schedule. Easily identify the total monthly gross sales, discounts, returns, COGS and Marketing Expenses for your wholesale business. Once you have the quick brief on the core financial metrics, you can continue on in the schedule to view the Sales Cash Flow Summary.<br>

#### Sales Cash Flow Summary

Knowing that payment schedules in wholesale are quite variable and dependent on the specific account, you are able to view your monthly wholesale cash flow in this row. Now, it’s time to dive into the details and see how the core financial metrics, including the cash flow, is broken down into more granular categories. <br>

#### Gross Sales by Account

This section identifies the main drivers for the wholesale gross sales and direct costs, making it the “bread and butter” of the wholesale tab

**Definitions of the Section:**&#x20;

* Account: the business that purchases your product and sells it either directly to consumers in their stores or sells it again to other stores (e.g., Distributors).&#x20;
* Stores Selling: the number of individual stores your product is actively selling in
* Average SKUs per Store Selling: the number of individual product items present per individual store.&#x20;
* Velocity (Units Sold per SKU per Store Selling per week): the number of units sold per individual product item per individual store per week. This is a measurement of how fast your individual products are selling on average.

**Got more specific questions?**

{% content-ref url="/spaces/GWP01Uan8w7wePRkCAQS/pages/JIL9p5hP3IZ9pTXZcuqP" %}
[Contact Us](/help-1)
{% endcontent-ref %}


# Product

Your home to add any and all individual Product information.

Our most effective customers maintain this tab with all core information on SKUs (whether it's individual products or bundles) as a back bone to some of their forecasting across different channels.&#x20;

We are working on a native product mapping feature that will help the maintenance and reference of products across all Drivepoint plans.&#x20;

**Want to be a beta tester?**&#x20;

{% content-ref url="/spaces/GWP01Uan8w7wePRkCAQS/pages/JIL9p5hP3IZ9pTXZcuqP" %}
[Contact Us](/help-1)
{% endcontent-ref %}


# Opex

Forecast your Operating Expenses.

In this video, we cover:

1. An overview of the Opex schedule
2. How to forecast expenses for your existing GL accounts
3. How to forecast expenses for a new account that's not in the GL

{% embed url="<https://youtu.be/BPtHRcwKUn4>" %}


# Payroll

Forecast payroll from the headcount schedule: an overview of the Payroll tab and how to project salaries and headcount over time.

In this video, we cover:

1. An overview of the Payroll schedule
2. How to forecast Payroll using the headcount schedule

{% embed url="<https://youtu.be/KVmHqZ6pGHg>" %}


# Tax

Coming soon!

Let us know if you need tax documentation and guides asap!

{% content-ref url="/spaces/GWP01Uan8w7wePRkCAQS/pages/JIL9p5hP3IZ9pTXZcuqP" %}
[Contact Us](/help-1)
{% endcontent-ref %}


# Assets

Forecast your balance-sheet assets in the SmartModel, including how Cash and Inventory are projected in the Asset schedule.

In this video, we cover:

1. An overview of the Asset schedule
2. How we forecast Cash in the Asset schedule
3. How to forecast Inventory using the Asset schedule

{% embed url="<https://youtu.be/1sp9621MREU>" %}


# Liabilities & Equities

Forecast liabilities and equity: Accounts Payable via Days Payable Outstanding, credit card and line-of-credit balances, and new debt or equity investments.

In this video, we cover:

1. An overview of the Liabilities & Equity schedule
2. How to forecast Accounts Payable using Days Payable Outstanding
3. How to forecast Credit Card and Line of Credit Balances
4. How to add new Debt or Equity investments into the model

{% embed url="<https://youtu.be/uT-waXIar7g>" %}


# Debt

Coming soon!

If you require documentation or video guides asap, please contact us asap!

{% content-ref url="/spaces/GWP01Uan8w7wePRkCAQS/pages/JIL9p5hP3IZ9pTXZcuqP" %}
[Contact Us](/help-1)
{% endcontent-ref %}


# FAQ: SmartModel

Browse through some of the most popular questions that Drivepoint users have. Maybe we can answer some of yours🙏

## Export Options

<details>

<summary>Is there a simple way to pull an excel doc showing the full budget, with balance sheet, to show bankers and investors?</summary>

I would recommend sending just an export of the Monthly Summary tab (if you need it monthly) or the 3Y Plan Tab if Annual Summary works. I

f on Web version of excel (vs. Desktop App) File -> Create a Copy -> Download a Copy and then just Copy those tabs into a new Separate Workbook. (If in Desktop you can just copy the tabs right away).&#x20;

Once in that new workbook with just copy of the tabs, you can break the links to the main model so that if an investor opens it it won't try to refresh etc.

</details>

## Modeling

<details>

<summary>How do I forecast DTC Net Revenue?</summary>

**To forecast net revenue** navigate to the the DTC - Acquisition and DTC OTP tab.&#x20;

-> DTC - OTP schedule is where first time & returning orders and first time & returning gross AOV assumptions can be toggled

**For the Ad spend forecast**, navigate to the Acquisition tab.

-> This is where direct ad spend is divided by first time orders to calculate Blended CaC for historical periods, which you can then update in forecast.&#x20;

</details>

<details>

<summary>How do I add a new product in the model?</summary>

**Step 1:** Start on the Product tab in the SmartModel™️

*New Products are entered into the Average Unit Cost - Material and Direct Labor section -> this will populate product lists throughout the model (DTC, Amazon, Wholesale and Retail Tabs).*&#x20;

**Step 2:** Enter assumptions for average cost by month in this section

*Assumption percentages for freight, import tax, and shipping costs can be entered in sections below*

**Step 3:** However if your inputs from above include those amounts you can disregard these.&#x20;

**This will all flow into a summary of landed costs by product by month at the top of the schedule**

</details>

<details>

<summary>How do I calculate and update AOV?</summary>

**We have updated our AOV calculation so you can now incorporate the sale of new products more explicitly in the DTC - OTP tab.** *Previously we just used Shopify AOV data to predict future AOVs in rows 42 and 87.*&#x20;

**Step 1:** Navigate to the yellow DTC - OTP tab in the SmartModel™️

The new method is to adjust “Attach %” which simply describes the number of each product (in units) in proportion to overall orders.&#x20;

**Step 2:** Attach % = 100% would suggest 1 unit per Order, while 200% would suggest 2 units per order.&#x20;

These rates for historical (legacy) products are calculated based on Shopify data for your reference while forecasts require your input based on expectations of take rates on those new products.&#x20;

Additionally, overall attach rates for legacy products will likely decrease after launch of new products given the size of those AOVs so it may be prudent to trend down those legacy rates relative to historical trends.

**Step 3:** Repeat these attach % inputs for First-Time and Returning Customers.&#x20;

These rates will then be used in combination with GMV or prices per unit by product to estimate overall AOVs for First-Time and Returning customers.

</details>

<details>

<summary>Where do I input my Sales Mix?</summary>

Given the AOV updates using attach %, the Sales Mix on the DTC tab will now be an Output vs. Input.&#x20;

**Step 1:** Navigate to the DTC tab

**Step 2:** Scroll to the "Costs of Goods Sold - Units Sold" section

**Step 3:** View list of products which mirrors the input on the yellow Product tab schedule.&#x20;

</details>

<details>

<summary>Orders vs. Order Items vs. Units Ordererd (<em>with image)</em></summary>

<img src="https://2524697288-files.gitbook.io/~/files/v0/b/gitbook-x-prod.appspot.com/o/spaces%2FrQPOpSFypZMSNdEbaKKD%2Fuploads%2FcY7xscGXjwfg86c8anHR%2Fimage.png?alt=media&amp;token=1499765e-9a28-4f04-9092-aa79fa3f48e9" alt="Visual representation of differences between orders, order items and units ordered." data-size="original">

* **Order**: A customer's completed request to purchase one or more products from the store.
* **Line Items (on Amazon as Order Items)**: Distinct product variants that were added to the order. A line item will have an associated quantity that represents the number of units purchased for that distinct product variant.
* **Units Sold (on Amazon as Units Ordered)**: The total number of products that were purchased on the order. This is calculated by summing up the quantities per line item.

</details>


# Add-In Best Practices

Understanding the golden rules and best practices of using the Excel Add-In.

{% embed url="<https://www.loom.com/share/76f5560346954345beae582dd1689eea>" %}

### Speed

We are optimized for Desktop. Please use the Drivepoint Add-In on Desktop for the best speed results when it comes to Data Import, Roll Forward or Import Plan&#x73;*.*&#x20;

### Understanding Data Freshness

Before starting your financial planning task for the day, it is good practice to understand the current data freshness of the model.&#x20;

Let's use the following data freshness stamp as an example:&#x20;

<figure><img src="https://551491405-files.gitbook.io/~/files/v0/b/gitbook-x-prod.appspot.com/o/spaces%2F6vYp0ryZvSoKCyDwCTG9%2Fuploads%2FsMxEDKSjBlAza6fvQwRD%2Fimage.png?alt=media&amp;token=25f09446-6fb2-4906-ad8d-63a76e643b22" alt=""><figcaption></figcaption></figure>

1. We can see that the last full data import occurred around 2pm on September 5th
2. The data we imported with that full data import is from 4:46am in the morning

**Now what does that mean?**

With the data import I did around 2pm, I did NOT capture any orders or financial data changes that occured between 4:46am and 2pm on September 5th.&#x20;

In other words, if I did an accounting change at 11am on September 5th and I would like that to be updated in the model, I need to reach out to the Drivepoint Team to run the data warehouse again. However, if I just care about the Shopify and Amazon orders from September 04 and earlier, I am all set with the current data import.&#x20;

**Questions?**

{% content-ref url="/spaces/GWP01Uan8w7wePRkCAQS/pages/JIL9p5hP3IZ9pTXZcuqP" %}
[Contact Us](/help-1)
{% endcontent-ref %}

### Saving a New Plan for Financial Planning from the Live Model

If you want to use the model for analyses and play around in it, make sure you save the current state of the model:&#x20;

1. Click on "Make a copy" in the Add-In
2. Add a name and description (e.g. "Forecast 03/06/24" - "saving current model before What-if analyses")
3. Click "Save"
4. Now you can safely play around in the plan that you created which won't impact the live model

### **💡Quick Links:**&#x20;

{% content-ref url="/pages/Gv3SgtoxmRDjqB2ypvRV" %}
[Plans](/navigating-the-excel-add-in/plans)
{% endcontent-ref %}

{% content-ref url="/spaces/GWP01Uan8w7wePRkCAQS/pages/jMHTotZWbk3hSGAmSneE" %}
[Provide Feedback](/help-1/provide-feedback)
{% endcontent-ref %}


# Drivepoint's Add-In Agent

This guide walks you through what the agent can do and how to get the most out of it.

### Meet Your AI-Powered Agent in the Drivepoint Add-In

The Drivepoint Add-In now includes an AI-powered agent that works directly inside your Excel SmartModel™. Instead of navigating menus or waiting on the team, you chat with the Drivepoint Add-In Agent in plain English and it takes action in your SmartModel™ in real time.

{% embed url="<https://www.loom.com/share/eea1619b759e47ac900dc93699c8b89b>" %}

#### Quick Start: Your First 5 Minutes

Open your SmartModel in Excel and launch the Drivepoint Add-In. Click on **"Chat"** inside the Sidepanel menu. Try these three prompts in order:

**Step 1 — Get oriented**

```
Tell me about this model
```

The agent reads your SmartModel and gives you a summary: company name, model version, date range, active channels, and key metrics. This confirms the agent is connected and reading your data correctly.

**Step 2 — Pull in fresh data**

```
Import my latest Shopify sales
```

The agent fetches your most recent data from Drivepoint's data warehouse and writes it directly into your model. No exports, no copy-paste. You can also try:

```
Pull in my QuickBooks data
```

```
Import retention predictions
```

**Step 3 — Ask a question**

```
What was revenue last month?
```

The agent reads from your model and responds in plain English. You're up and running.

***

#### What You Can Do

The agent can help you understand your model, pull in fresh data, answer questions about your numbers, and build the schedules and reports you need. Here's what you can do today.

> **Tip:** You don't need to memorize exact phrasing. Ask the way you'd ask a teammate. If the agent isn't sure what you mean, it'll ask a clarifying question.

***

#### Model Ops

Understand, check, and maintain your SmartModel.

**Summarize Model**

Get oriented in any SmartModel — company, version, date range, channels, and key metrics.

Try these:

```
Tell me about this model
```

```
Summarize this model
```

```
Give me an overview
```

```
Stand up the model
```

**Interrogate Model**

Trace any number back to its source. Select a cell first, then ask the agent to walk you through the logic.

Try these:

```
Where does that number come from?
```

```
Why is revenue $X?
```

```
Walk me through this
```

```
What's driving that line?
```

**Tip:** Click on a cell before asking "trace this" or "what's this?" — the agent uses your selection as context.

**Keep Your Model Healthy**

The agent handles the maintenance work so you don't have to — auditing, fixing broken references, optimizing, and navigating your workbook.

**Audit before you send.** Sanity-check a model before it goes to a stakeholder, investor, or board.

```
Audit this model
```

```
Validate before I send
```

**Fix broken references.** Scan for `#REF` errors, broken formulas, and formatting inconsistencies — then repair them.

```
Do I have any broken references?
```

```
Fix the broken formulas
```

**Speed up slow workbooks.** Diagnose volatile formulas and reduce file size.

```
The model is slow
```

```
Reduce file size
```

**Navigate the workbook.** Open any tab or find what you're looking for.

```
Open the P&L tab
```

```
Where do I change CAC?
```

**Cell Edits & Formulas**

Need to make a quick change or build a formula? Ask the agent.

Try these:

```
Change cell B5 on the Settings tab to 12
```

```
Write a SUMIFS formula to total revenue for January
```

***

#### Data & Workflow

Keep your model current with live data from Drivepoint's warehouse.

**Import Data on Demand**

Tell the agent to pull in your latest data and it writes directly into your model from Drivepoint's data warehouse.

Try these:

```
Import my latest Shopify sales
```

```
Pull in my QuickBooks data
```

```
Import retention predictions
```

```
Pull in my Amazon sales data
```

**Tip:** You don't need to know which import to use. Just describe what you need — "I need my latest sales data" — and the agent will recommend the right import for your setup.

**Handling unmapped accounts:** If your financial accounts aren't fully mapped yet, the agent will let you know and redirect you to the mapping screen so you can resolve it before importing.

**Imports with breakdowns:** Some imports require input from you — for example, how you want product data grouped. The agent will ask you before proceeding.

**Roll Your Model Forward**

One prompt and the agent moves your SmartModel to the next period, handling tab logic, references, and everything in between.

Try this:

```
Roll forward to the next month
```

**Tip:** After rolling forward, follow up with a data import to pull in the latest actuals for the new period. The agent handles both steps from the chat.

**Shortcut:** If your books are closed, try:

```
My books are closed
```

The agent will import the latest QuickBooks information and ask whether you'd like to roll the model forward — handling both steps in one flow.

***

#### Analysis

Turn your model into answers. Ask about any metric, time period, or line item in plain English.

**Ask Questions About Your Numbers**

The agent reads your model and answers in plain English.

Try these:

```
What was gross margin last quarter?
```

```
Which channel has the highest margin?
```

```
How does my DTC revenue compare to Amazon this month?
```

```
What's our total inventory?
```

**Tip:** Be specific with time periods and line items. "What was COGS in February?" gives you a sharper answer than "Tell me about costs."

**Variance Analysis**

Plan vs. actual, pacing, and pre-rolls.

Try these:

```
Why did we miss?
```

```
Budget vs. actual
```

```
Are we on track?
```

```
Give me a pre-roll
```

**Margin Analysis**

Profitability by channel and mix. Build margin bridges and diagnose margin decline.

Try these:

```
What are our margins?
```

```
Amazon vs. DTC profitability
```

```
Build a margin bridge
```

```
Why are margins declining?
```

**Product Cost Analysis**

Unit economics and COGS decomposition — landed cost per unit, bill of materials, cost structure.

Try these:

```
Break down product costs
```

```
What's the landed cost per unit?
```

```
Walk me through unit economics
```

```
Decompose COGS
```

**SKU Rationalization**

Find what's working and what to cut across your product portfolio.

Try these:

```
Run a SKU rationalization
```

```
Which SKUs are dragging margin?
```

```
Which products should we kill?
```

```
Do we have too many SKUs?
```

**Cohort Analysis**

Retention, LTV, CAC payback, and repeat purchase rates.

Try these:

```
Show me cohort retention
```

```
What's our LTV:CAC ratio?
```

```
What's our payback period?
```

```
What's our repeat purchase rate?
```

**Marketing Efficiency**

CAC, ROAS by channel, and ad spend diagnostics.

Try these:

```
What's our CAC?
```

```
What's our ROAS by channel?
```

```
Where should we cut marketing?
```

```
How efficient is our ad spend?
```

**Inventory Analysis**

Stock levels, weeks of supply, reorder signals, and dead stock.

Try these:

```
Are we at risk of stocking out?
```

```
What's our weeks of supply?
```

```
What do we need to reorder?
```

```
Do we have dead stock?
```

**Trade Spend Analysis**

Promos, deductions, and retailer-level P\&L.

Try these:

```
Analyze trade spend
```

```
Are our promotions working?
```

```
What's our deduction rate?
```

```
Show me retailer profitability
```

***

#### Builder

Create schedules, reports, and scenarios from a single prompt.

**Build Schedule**

Spin up revenue builds, COGS schedules, headcount plans, depreciation tables, and more.

Try these:

```
Build a revenue build
```

```
Make a COGS schedule
```

```
Build a headcount plan
```

```
Create a depreciation table
```

**Build Report**

Board decks, monthly close reports, and investor updates.

Try these:

```
Build a board deck
```

```
Create a monthly close report
```

```
Put together an investor update
```

```
Package this up
```

**Create Scenario**

What-ifs, stress tests, and runway levers.

Try these:

```
What if we raise prices?
```

```
What if CAC goes up 10%?
```

```
What levers extend runway?
```

```
Stress test this
```

**Compare Scenarios**

Side-by-side plan comparison — budget vs. latest forecast, plan A vs. plan B.

Try these:

```
Compare scenarios
```

```
Which scenario is better?
```

```
Budget vs. latest forecast
```

```
Show me plan A vs. plan B
```

**Investor Readiness**

Get your model raise-ready with due diligence checks.

Try these:

```
Is this model investor-ready?
```

```
Run a due diligence check
```

```
What would an investor flag?
```

```
Is this ready to share with VCs?
```

***

#### Tips for Great Answers

* **Be natural.** Ask the way you'd ask a teammate — no special syntax needed.
* **Point at something.** Select a cell or range first, then ask *"what's this?"* or *"trace this."*
* **Iterate.** Follow up with *"go deeper,"* *"break that out by channel,"* or *"now compare to last quarter."*
* **Ask for receipts.** If you want the logic, say *"show your work"* or *"explain the formula."*

***

#### What's Coming Next

We're actively iterating on the agent based on beta feedback. On the near-term roadmap:

* **Streaming responses** — See the agent's answers render in real time instead of waiting for the full response.
* **Bring your own skills** — Upload custom capabilities tailored to your team's workflows, conventions, and reporting templates.
* **Your feedback, shipped** — The roadmap is being shaped by what we hear from beta customers. Tell us what's missing, what's clunky, or what would save you an hour a week.

***

### Need Help?

Your Drivepoint rep can walk you through any of these workflows live. You also have a dedicated Slack channel for real-time feedback during the beta — drop questions, flag issues, or share what's working. We're building this with you.


# My books are closed - what do I do?

I just closed my books and I want the recent data in my model. What do I do?

At Drivepoint we refer to the process of updating the model after the accounting data for the last month closed, “rolling the model forward”.&#x20;

#### So what should you do after your accountant let you know that the books are closed for last month?

*If you have done this process a couple of times, you can click on “Import All Data” and then navigate to the* [*Roll Forward*](broken://pages/ViySFQSKE7pwxhQPIT8r) *step.*&#x20;

**First we need to import fresh QBO data into your model.**&#x20;

1. Navigate to Drivepoint
2. Open your SmartModel™
3. Open the Drivepoint Add-In&#x20;
4. Click on “Data Import”
5. Click on the ⬇️ icon next to QBO or Netsuite
6. If the *import* was skipped, you need to map new accounts that we found in your financial data. The *UI will take you there: map new accounts to Drivepoint categories and click “Save Accounts mapping”. Find more info* [*here*](https://docs.drivepoint.io/help/navigating-the-excel-add-in/core-functions-of-the-drivepoint-add-in/import-data/mapping-financial-accounts).&#x20;
7. Drivepoint will now import your financial (QBO or Netsuite) data. Drivepoint imports financial data in the R-GL tab in your model.
8. You can see that the import has worked if there’s data populating for the month you just closed in the R-GL tab inside your model.&#x20;

**Now that we have mapped any new accounts and have fresh financial data we should also import all of the other data sources** to make sure we have the complete business data in the model.&#x20;

1. Click on Data Import
2. Click on the ⬇️ icon next to Shopify and/or Amazon. Both can be run in parallel.&#x20;
3. Drivepoint will now import your operational data. The data populates in multiple different tabs (R- DTC/AMZ Product Sales Mix, R- DTC/AMZ Retention Predictions).&#x20;
4. Depending on the size of your data, this can sometimes take 5-8 min since we are also importing the Drivepoint retention predictions (our prediction of your returning customers for the next months).
5. For a quick check whether the data looks right, navigate to R-Product Sales Mix and see if the data has populated for the month you are trying to close

**Now that we have full fresh data, let’s actually roll the model forward** - a motion that essentially grabs all of the fresh data and turns the month you are trying to close from “Forecast” to “Actuals”.&#x20;

1. In the Drivepoint Add-in, click on “[Roll Forward](broken://pages/ViySFQSKE7pwxhQPIT8r)”
2. Since we just imported fresh data, you can skip the data import pop-up screen
3. Select the month that you are trying to close (last month of actuals)
4. Select all of the tabs you want to roll forward. We strongly recommend to roll forward ALL tabs
5. Confirm your selection
6. Drivepoint will now roll the model forward by grabbing the fresh data and converting the month from forecast to actuals
7. Upon completion, you can navigate to M-monthly and see whether in Row 3 the label has changed from “Forecast” to “Actual”

**Check for errors to ensure everything looks good:**

* Look into the forecast: any big crazy numbers?
* M-monthly checks
* Assets & Liabilities - make sure they are balanced
* Annual views: is cash okay? Does it look reasonable?

### Congrats - you have rolled your model forward🎉


# Installing the Drivepoint 2.0 Add-In

The Drivepoint Add-In is your interface between your SmartModel™ and the Drivepoint Web-App and Data Warehouse.

### Step by Step Instructions

1. Open your SmartModel™ or any plan in Excel
2. Click on the "Home" ribbon
3. Click on "Add-Ins" on the far right of the Home ribbon

<figure><img src="https://551491405-files.gitbook.io/~/files/v0/b/gitbook-x-prod.appspot.com/o/spaces%2F6vYp0ryZvSoKCyDwCTG9%2Fuploads%2FwQe9JTi2Li5IgdwlKz8D%2Fimage.png?alt=media&amp;token=8944bdb6-27b7-4cdd-b61b-d6b6e8407f4a" alt=""><figcaption><p>Find the "Add-Ins" button on the far right</p></figcaption></figure>

4. Click on "More Add-Ins" on the bottom right of the drop-down

<figure><img src="https://551491405-files.gitbook.io/~/files/v0/b/gitbook-x-prod.appspot.com/o/spaces%2F6vYp0ryZvSoKCyDwCTG9%2Fuploads%2FKSHm7ctwuAV3mSmU5snf%2Fimage.png?alt=media&amp;token=083cac9d-6c02-4f48-b4ff-79dd9bfd9814" alt=""><figcaption></figcaption></figure>

5. Search for "Drivepoint Beta" in the Search box

<figure><img src="https://551491405-files.gitbook.io/~/files/v0/b/gitbook-x-prod.appspot.com/o/spaces%2F6vYp0ryZvSoKCyDwCTG9%2Fuploads%2Fi1ooVKo5mFPayFsDYs44%2Fimage.png?alt=media&amp;token=33b406f7-a24c-401d-8d20-f28cea4b3fe1" alt=""><figcaption></figcaption></figure>

6. Click on "Add" for the Drivepoint Beta Add-In

<figure><img src="https://551491405-files.gitbook.io/~/files/v0/b/gitbook-x-prod.appspot.com/o/spaces%2F6vYp0ryZvSoKCyDwCTG9%2Fuploads%2FA5pQDs77a25j3XkuQKJ3%2Fimage.png?alt=media&amp;token=f0b11bd7-78fe-4fb7-9c9e-857d5c8043de" alt=""><figcaption></figcaption></figure>

7. Accept the Terms & Conditions
8. The Drivepoint Add-In should now show up in your Excel ribbon and you can log in with your Drivepoint account🎉

*P.S. If you are on Desktop Excel you might experience difficulties with logging in with your Google account. In the* [*Drivepoint Web-App*](https://app.drivepoint.io/) *you can hold the "Option" key and click on your icon on the top right to merge your accounts and login via email in the Desktop Add-In since we will now recognize your Google account as a manual way of logging in.*&#x20;

### *OR follow along the* [*Video Tutorial*](https://www.loom.com/share/65623435bd33418eabd07b01f13c54c1?sid=36743cbc-ab81-407c-b0b8-316298f548fb)*.*&#x20;


# Core Functions of the Drivepoint Add-In

Why do I need the Add-In?

**Drivepoint 2.0 is the tool you need in order to communicate between Excel and Drivepoint.**&#x20;

For example, we pull your source data into the Drivepoint Cloud. In order to get it from the Drivepoint Cloud into an Excel file, you need to [import the data](/navigating-the-excel-add-in/core-functions-of-the-drivepoint-add-in/import-data) via the Add-In. This logic applies that if you make changes in Excel, you need to [sync them to the Drivepoint Cloud](/navigating-the-excel-add-in/core-functions-of-the-drivepoint-add-in/sync-to-drivepoint).&#x20;

Check out the Quick Links below to Learn More.&#x20;

<figure><img src="https://551491405-files.gitbook.io/~/files/v0/b/gitbook-x-prod.appspot.com/o/spaces%2F6vYp0ryZvSoKCyDwCTG9%2Fuploads%2Fm5v4kHEh4TwcqJkQKHdT%2Fimage.png?alt=media&amp;token=4dc7412a-1f5b-4734-91e3-c96721697f15" alt=""><figcaption><p>Visual Overview</p></figcaption></figure>

## Quick Links

{% content-ref url="/pages/YaaEm8vmktCNBUOsRduz" %}
[Import Data](/navigating-the-excel-add-in/core-functions-of-the-drivepoint-add-in/import-data)
{% endcontent-ref %}

{% content-ref url="/pages/yFXr4oMGMA7z7Ca1whYI" %}
[Model Roll Forward](/navigating-the-excel-add-in/core-functions-of-the-drivepoint-add-in/model-roll-forward)
{% endcontent-ref %}

{% content-ref url="/pages/BDG4CdsPsWU7CXhtbchx" %}
[Sync to Drivepoint](/navigating-the-excel-add-in/core-functions-of-the-drivepoint-add-in/sync-to-drivepoint)
{% endcontent-ref %}

{% content-ref url="/pages/0xBj8tTqZMY9RnpbP0D0" %}
[Import Plans to Compare in SmartModel™](/navigating-the-excel-add-in/core-functions-of-the-drivepoint-add-in/import-plans-to-compare-in-smartmodel-tm)
{% endcontent-ref %}


# Intro: Video Walk-Through

How to make the most out of the Add-In

{% embed url="<https://www.loom.com/share/1ea27f8d8fc94512b52a2ab8a19185bd?sid=b65bc0cc-99fc-435b-8c90-fc093151b230>" %}


# Signing In

How to sign in to the Drivepoint Add-In: Google SSO on Excel Web, manual email login on Desktop, and fixes for common sign-in issues.

### Excel Web Version

Many of our customers have opted into using the Google SSO option to sign up to Drivepoint. You can use it or the manual email login to sign into Drivepoint.&#x20;

### Desktop

Google SSO unfortunately does not work on the Desktop version. You will have to manually sign in.&#x20;

<details>

<summary><strong>Help?! I don't think I have a manual sign-in option?</strong></summary>

To use your Google email and password, navigate to the Drivepoint Web-App. Click Alt / Option and click on your icon on the top right. You can see an option to link your Google account. Once successfully linked you can sign into Drivepoint on Desktop manually but with your Google Email + Google Password.&#x20;

</details>

<details>

<summary>Help?! I need to re-add the Add-In every single time?</summary>

We sometimes observe this is the case when you are not signed in properly with your Excel account or if your company does not have a Microsoft Excel 365 license. [Reach out](/help-1) to our team with any questions in terms of which email address we should add to your Drivepoint account so that you don't have to re-add the Drivepoint Add-in every time.&#x20;

</details>


# Home

Right when you log into the Add-In you will land on the Home page. This is like a status page for every Plan.

Start here to understand where you are at and what the current status of each Plan is before you dive into it.&#x20;

<figure><img src="https://551491405-files.gitbook.io/~/files/v0/b/gitbook-x-prod.appspot.com/o/spaces%2F6vYp0ryZvSoKCyDwCTG9%2Fuploads%2Fv16vnvmjPJv4TJp745Fa%2Fimage.png?alt=media&amp;token=f814b02a-0295-4bb0-95f9-2d87d4217860" alt="" width="174"><figcaption><p>Honey - I am home!!</p></figcaption></figure>

### Let's dive into all of the sections...

1. See who made the last changes and more importantly WHEN

<figure><img src="https://551491405-files.gitbook.io/~/files/v0/b/gitbook-x-prod.appspot.com/o/spaces%2F6vYp0ryZvSoKCyDwCTG9%2Fuploads%2FqSgR4kUHAe15RGOWQf7H%2Fimage.png?alt=media&amp;token=59b2d95c-9405-4574-b2f8-3aa8d23e2c66" alt="" width="168"><figcaption></figcaption></figure>

2. Understand when the model is "ahead" of the cloud - *learn more about* [*Syncing to Drivepoint*](/navigating-the-excel-add-in/core-functions-of-the-drivepoint-add-in/sync-to-drivepoint)

<figure><img src="https://551491405-files.gitbook.io/~/files/v0/b/gitbook-x-prod.appspot.com/o/spaces%2F6vYp0ryZvSoKCyDwCTG9%2Fuploads%2FQzIHGa3bn6OsftRp8ZYC%2Fimage.png?alt=media&amp;token=5ab9f46c-142f-47cd-8ffe-96cc02664fae" alt="" width="170"><figcaption></figcaption></figure>

3. Learn about the Data Freshness per source

<figure><img src="https://551491405-files.gitbook.io/~/files/v0/b/gitbook-x-prod.appspot.com/o/spaces%2F6vYp0ryZvSoKCyDwCTG9%2Fuploads%2FkFVzHuQtdAgqmX9ZNyrv%2Fimage.png?alt=media&amp;token=b14e6ab1-b6b4-4b57-ad79-5c4efb1313e2" alt="" width="167"><figcaption></figcaption></figure>

*New data is not automatically imported into the SmartModel™. You will need to import fresh data.*&#x20;

**Example from Screenshot**: "Last full data import Oct 07, 2024 07:17 PM. Latest data from data warehouse is from Oct 08, 2024 06:27 PM".

This means that the last time someone imported ALL data sources into the model occurred in the evening of October 07. However, Drivepoint has data available from October 08 meaning that we could get fresher data into the SmartModel™. We should "Go to [Data Import](/navigating-the-excel-add-in/core-functions-of-the-drivepoint-add-in/import-data)" to import all new fresh data.&#x20;

*If you are an advanced user, you can also just import specific tables, e.g. "Shopify DTC Monthly". If you click on the arrows in the data freshness box you can see the last time an individual table was imported from Shopify.*&#x20;

* See who created the file and who it's shared with

<figure><img src="https://551491405-files.gitbook.io/~/files/v0/b/gitbook-x-prod.appspot.com/o/spaces%2F6vYp0ryZvSoKCyDwCTG9%2Fuploads%2FgGQxmBxXWTWANE9Fq9Xn%2Fimage.png?alt=media&amp;token=23d4818b-30f3-4c76-863b-3d1d3cb2a360" alt="" width="164"><figcaption></figcaption></figure>


# Import Data

Forget spending hours of manually copy and pasting data from your data sources. Drivepoint got you with the click of a button.

**Import all data from all of your connected data sources**

*Before you engage in any FP\&A tasks for the day we recommend to import all data to make sure your model is up to date.*&#x20;

1. Click on "Import Data"
2. Click on "Import All Data"
3. Success - your model is updated with fresh data🎉

**Import source-specific data**

*When assessing how you are pacing mid-month with DTC or Amazon data, we recommend to import only Shopify or Amazon data.*&#x20;

1. Click on "Import Data"
2. Click on ⬇️ for Shopify
3. Success - your model is updated with fresh Shopify data

<figure><img src="https://551491405-files.gitbook.io/~/files/v0/b/gitbook-x-prod.appspot.com/o/spaces%2F6vYp0ryZvSoKCyDwCTG9%2Fuploads%2Fz7xogZxcGtvLLyyym2ch%2FImport%20Data%20Home.png?alt=media&amp;token=5aec5e21-a7ef-4878-bfd5-d216f4595ff3" alt="" width="347"><figcaption></figcaption></figure>

## FAQ Data Import

<details>

<summary>My QBO was skipped. Why?</summary>

This likely happened because some of your accounts are not mapped to Drivepoint categories. In order to map Drivepoint categories, click on the side arrow next to QBO in data import and map the accounts to the Drivepoint categories.&#x20;

If the issue persists, please contact Drivepoint Support via <support@drivepoint.io>.

<br>

</details>

<details>

<summary>My data was only imported partially. What should I do?!</summary>

Sometimes it can happen. Don't worry! There is a way to import specific tables that might have failed in the "All Data Import" or specific data import per source. Here's how you can import a specific table that might have failed:

1. Click on the Info button to see which table did not import (e.g. R - DTC Retention)
2. Click on the **>** arrow next to specific data source that failed to import a table&#x20;
3. Select the table in the drop-down that failed to import
4. Change or keep the defaults of the table settings *(if you are unsure, stick with the defaults)*
5. Click on import
6. Success - it should have worked! If you are still experiencing issues please contact <support@drivepoint.io>

</details>

<details>

<summary>What tables are imported when I import "All Shopify Data"?</summary>

We will import the following tables when importing all Shopify data:&#x20;

1. Product Sales Mix
2. DTC Retention Predictions
3. Cohorted Sales
4. Monthly Shopify Data Pivot

All of these options can also be selected individually when clicking the ">" next to the Shopify option in the Data Import screen.&#x20;

</details>

<details>

<summary>What tables are imported when I import "All Amazon Data"?</summary>

For Amazon data, we import the following tables:&#x20;

1. Amazon Monthly
2. Amazon Product Sales Mix&#x20;
3. Amazon Retention Predictions

All of these options can also be selected individually when clicking the ">" next to the Amazon option in the Data Import screen.&#x20;

</details>

<details>

<summary>Where does the imported data live?</summary>

Newly imported data lives in the "R-" tabs in your Excel files. For example:&#x20;

* R-GL: is the general ledger and therefore the raw data import sheet for your financial information that maps throughout the file
* R- DTC Product Sales Mix: is the import tab for Shopify product sales mix actuals and information.&#x20;

If you import fresh data, the model should automatically update with the fresh data BUT it is always good to double check. [Reach out to our team](/help-1) if you want to learn more.&#x20;

</details>


# Mapping Financial Accounts

You need to map all of your accounts to Drivepoint categories. The mappings are stored in the Drivepoint cloud and will get pulled into every Plan when importing financial data.

## How do I map my accounts?

When you are importing all data and your QBO or Netsuite is skipped, you receive an alert that you have new accounts to map. Please click on that link.&#x20;

### Step-by-step Instructions

1. Open the Drivepoint Add-In and click on Import Data
2. Next to your Financial data click on the > arrow

<figure><img src="https://551491405-files.gitbook.io/~/files/v0/b/gitbook-x-prod.appspot.com/o/spaces%2F6vYp0ryZvSoKCyDwCTG9%2Fuploads%2FPFiJ9qNsG15iTu10NRqt%2Fimage.png?alt=media&amp;token=e92b0ba4-ea80-4699-810b-3a007b7286fb" alt="" width="354"><figcaption></figcaption></figure>

3. Expand the Add-In Menu to map accounts for better visibility into all fields

<figure><img src="https://551491405-files.gitbook.io/~/files/v0/b/gitbook-x-prod.appspot.com/o/spaces%2F6vYp0ryZvSoKCyDwCTG9%2Fuploads%2FH5z6dcSK8jovDmdUwKYb%2Fimage.png?alt=media&amp;token=8c0137f8-09e8-4ad8-bd2a-1f654686eded" alt="" width="180"><figcaption></figcaption></figure>

2. Click on "Unmapped only" to get a better view of the accounts you still need to map

<figure><img src="https://551491405-files.gitbook.io/~/files/v0/b/gitbook-x-prod.appspot.com/o/spaces%2F6vYp0ryZvSoKCyDwCTG9%2Fuploads%2Fs601j40UyyRd9OJglJJk%2Fimage.png?alt=media&amp;token=bc6b82eb-a95c-4af1-ad67-2b7979cdb4af" alt="" width="357"><figcaption></figcaption></figure>

3. Scroll through the options in the Drivepoint menu to map every unmapped account

<figure><img src="https://551491405-files.gitbook.io/~/files/v0/b/gitbook-x-prod.appspot.com/o/spaces%2F6vYp0ryZvSoKCyDwCTG9%2Fuploads%2Fujgdlq2QWRZDEZS6xRHX%2Fimage.png?alt=media&amp;token=384ba09e-d537-4891-be83-74f6d78e2522" alt="" width="357"><figcaption></figcaption></figure>

4. If you are unsure of the unmapped account, you can also scroll to the right to "Full Account Information" and hover over the row to see more information from your accounting software (QBO/Netsuite) that might help map this account to Drivepoint

<figure><img src="https://551491405-files.gitbook.io/~/files/v0/b/gitbook-x-prod.appspot.com/o/spaces%2F6vYp0ryZvSoKCyDwCTG9%2Fuploads%2F9X5debB0wlD4CBAyzTkA%2Fimage.png?alt=media&amp;token=5eafbb95-8030-408a-afcd-b4991eee42b8" alt="" width="174"><figcaption></figcaption></figure>

5. Once you have selected a Drivepoint category, scroll down and click on "Save Accounts Map"

#### **🎉 Congrats - you have now mapped your financial accounts to Drivepoint categories.**&#x20;

### **‼️ Important Note for Netsuite Customers**

There are some accounts that are always purposefully left unmapped because they could be totals or subtotals. Mapping those accounts will double count in M-monthly.&#x20;

**Examples of Accounts to leave unmapped:**

<figure><img src="https://551491405-files.gitbook.io/~/files/v0/b/gitbook-x-prod.appspot.com/o/spaces%2F6vYp0ryZvSoKCyDwCTG9%2Fuploads%2FEgi3tQ8OWAhzlrg1xkiG%2Fimage%20(9).png?alt=media&amp;token=03e6c2eb-2e15-4ee5-b80e-d62dbb012fd3" alt=""><figcaption><p>Please do not map these accounts!</p></figcaption></figure>


# Import All - What's Included?

### Overview

The **Import All** feature imports a curated set of your data into Drivepoint in a single click. Rather than importing every available table, Import All pulls in the most commonly used, model-ready data with sensible default settings — so your model is populated quickly without manual configuration.

**Only data sources that are connected and configured for your account will be imported.** If you don't have a particular integration set up, those tables are automatically skipped.

***

### What Gets Imported

#### Shopify (DTC)

* **Retention Predictions** — Forecast based on the previous month's cohort, projected 5 years forward
* **Monthly Sales Pivoted** — Monthly sales data in a model-ready pivot format

#### Amazon

* **Retention Predictions** — Forecast based on the previous month's cohort, projected 3 years forward
* **Monthly Sales Pivoted** — Monthly sales data in a model-ready pivot format

#### TikTok Shop

* **Retention Predictions** — Forecast based on the previous month's cohort, projected 3 years forward
* **Monthly Sales Pivoted** — Monthly sales data in a model-ready pivot format

#### Drivepoint

* **Retention Predictions** — Forecast based on the previous month's cohort, projected 5 years forward
* **Monthly Sales Pivoted** — Aggregated monthly data across all connected channels

#### Wholesale

* **Wholesale by PRA** — Sales data grouped by SKU and retailer
* **Wholesale by Distribution Center** — Sales data broken out by distribution center

#### Cin7 Omni

* **Sales Orders by Date** — Monthly sales orders grouped by product name
* **Sales Orders Raw** — Raw sales order data (orders with PO numbers)
* **Sales Orders Line Items** — Line item detail for sales orders (orders with PO numbers)
* **Purchase Orders by Date** — Monthly purchase orders grouped by product name
* **Purchase Orders Raw** — Raw purchase order records
* **Purchase Orders Line Items** — Line item detail for purchase orders
* **Products** — Your full Cin7 Omni product catalog

#### Cin7 Core

* **Sales Orders by Date** — Monthly sales orders grouped by product name, using Sale Order Date
* **Purchase Orders by Date** — Monthly purchase orders grouped by supplier
* **Purchase Orders Line Items** — Line item detail for purchase orders
* **Products** — Your full Cin7 Core product catalog

#### WMS / 3PL (via Trackstar)

* **Orders** — Fulfilled orders grouped by SKU, rolled up monthly
* **Inventory** — Current inventory levels grouped by SKU
* **Returns** — Returns grouped by SKU, rolled up monthly
* **Incoming Shipments** — Inbound shipments rolled up monthly
* **Products** — Your warehouse product catalog

***

### What's Not Included

Some tables are available in Drivepoint but are intentionally left out of Import All. These tend to be raw, granular, or highly model-specific — importing them automatically can cause formatting issues or overwrite customized data in your model.

Tables not included in Import All:

* Retention Variance, Nth Order Retention, EOM Projections
* Sales Unpivoted (Shopify, Amazon, TikTok)
* Cohorted Sales (Shopify, Amazon)
* Product Sales Mix (Shopify, Amazon, TikTok)
* Subscriber Metrics (Recharge)
* Monthly Ads

These tables are still available to import individually from the import menu.

***

### Frequently Asked Questions

**What if I don't have one of these integrations connected?** No problem — any table associated with a data source you haven't connected will simply be skipped. You won't see an error.

**Can I still import individual tables?** Yes. Import All is a convenience feature. All tables — including those not covered by Import All — remain available for individual import at any time.

**How are date ranges determined?** Where a date parameter is required (such as for Retention Predictions), Import All automatically uses the previous month as the reference point. You don't need to set this manually.

**What if I want different settings than the defaults?** Use the individual import option for that table instead. Import All is designed for a standard, out-of-the-box setup — for custom configurations, import tables individually and set your preferred parameters.


# Model Roll Forward

Rolling the model forward means to replace forecasts with actuals. Click on one of the links below to learn how to roll your model forward once the books for the month are closed.

## Step by Step Guide

* In the Drivepoint Add-in, click on “Roll Forward"
* Select the month that you are trying to close (last month of actuals)
* Select all of the tabs you want to roll forward. We strongly recommend to roll forward ALL tabs
  1. 💡 We include all tabs with proper Drivepoint formatting requirements in the list (e.g. Date Spine in Row 3, etc). **Reach out to** [**support**](https://docs.drivepoint.io/help/help-1) **if you want to learn more.**&#x20;
  2. 💡You can only roll forward some of the tabs (e.g. DTC) if you want to get a partial view of the *how the month is shaking out*
* Confirm your selection
* Drivepoint will now roll the model forward by grabbing the fresh data and converting the month from forecast to actuals
* Upon completion, you can navigate to M-monthly and see whether in Row 3 the label has changed from “Forecast” to “Actual”

## Links

{% content-ref url="/pages/yFXr4oMGMA7z7Ca1whYI" %}
[Model Roll Forward](/navigating-the-excel-add-in/core-functions-of-the-drivepoint-add-in/model-roll-forward)
{% endcontent-ref %}


# Help! I accidentally rolled forward?!

No worries - we know it happens.

## Option 1: Select an older version in Excel History

1. In Excel, click on "File"
2. Click on "Info"
3. Click on "Version History"
4. Select the previous or an older version of your SmartModel™

If there was a significant time delay or other team members have already made significant changes to the SmartModel™, you are also able to roll back your model. Click on the links below to learn more.

## **Option 2: Roll Model Back**

1. Open the Drivepoint Add-In
2. Click on "Roll Model Forward"
3. Click on "Roll Back" on the bottom of the screen
4. Select the date you would like to roll the model back to
   1. *💡 The date of current actuals is highlighted. You will need to select a PREVIOUS month to roll back actuals to forecasts.*&#x20;
5. Click "Model Roll Back"
6. View all selected tabs of your model by default
   1. *💡 Partial roll back: only select the tabs you want to roll back specifically*
7. Click "Roll Model Back"
8. Your model will now get rolled back

{% content-ref url="/spaces/GWP01Uan8w7wePRkCAQS/pages/JIL9p5hP3IZ9pTXZcuqP" %}
[Contact Us](/help-1)
{% endcontent-ref %}


# Sync to Drivepoint

Click "Sync to Web App" in the Add-In to inform Drivepoint of your Excel changes.

{% hint style="info" %}
**We recommend to sync to Drivepoint after your working session in any given Plan is done for the day**. See the examples below with concise use cases.&#x20;
{% endhint %}

### Example 01: Fundamental Business Changes

*See a video walk-through of the use case* [*here*](https://www.loom.com/share/d2a2861bd1e0476d805dd175e4d7e2ac?sid=c2517154-1a96-4b1a-8485-51107d62c6d4)*.*&#x20;

You just raised money and added every detail to the SmartModel™. In order for the team to immediately see all of the changes in the main Plans table and Visualize feature, you should sync the SmartModel™ to push the changes to the cloud so that the Web App knows about the category changes you made. After the sync is complete, the main plans table shows the future cash investment so my co-founders can immediately see the impact on EoP cash by the end of 2027.&#x20;

### Example 02: Last Minute Accounting Changes

You accidentally mapped Facebook Ads as Direct Advertising Spend: Marketplace. It should be mapped to Direct Advertising Spend: DTC. You re-map the expense in the Drivepoint Add-In (see mapping QBO) and re-import the data. Now, you want to export the updated P\&L report from the Web-App. You sync the model. After your sync is complete, the P\&L Report now shows Facebook Ad Spend in the Direct Advertising DTC bucket.&#x20;

### Example 03: Rapid Scenario Planning

You want to figure out which of the three loan providers is the best option given the company's long term goals. You branch off three different plans, one for each loan provider, and play around with the numbers extensively. Once you feel good about your work, you sync them to Drivepoint. Once the sync is complete, you can select the three plans from the Web-App to compare them across key metrics or visualization feature to get a better understanding of their impact on the business.&#x20;


# Scenario Planning ("Create New Plan")

Scenario planning made easy with Drivepoint.

Whatever business question you have that you would like to sensitize on, we recommend following these steps:&#x20;

1. Navigate to your live model (*or from whichever Plan you would like to start)*
2. Click on "Create new Plan"
3. Name, add and describe your scenario

{% hint style="info" %}
Folders can be created from the Web App Main Plans page  by clicking "Create Folder" on the top right.
{% endhint %}

<figure><img src="https://551491405-files.gitbook.io/~/files/v0/b/gitbook-x-prod.appspot.com/o/spaces%2F6vYp0ryZvSoKCyDwCTG9%2Fuploads%2FvuHzVoxZcmYwBofiDwVh%2Fcreate%20new%20plan%20%3A%20make%20a%20copy.png?alt=media&amp;token=f9e98e83-543b-4026-9f41-54be94683147" alt="" width="174"><figcaption><p>Create new Plan Interface</p></figcaption></figure>

4. Success - open your new Plan from the success notification

<figure><img src="https://551491405-files.gitbook.io/~/files/v0/b/gitbook-x-prod.appspot.com/o/spaces%2F6vYp0ryZvSoKCyDwCTG9%2Fuploads%2FOLn5XygOlg1elFNzHKDd%2Fimage.png?alt=media&amp;token=aa364b44-5206-481d-b87c-b5ba633618fe" alt="" width="174"><figcaption></figcaption></figure>

4. Start sensitizing across the different metrics that you would like to change in the newly created plan
5. Once you have completed the work in the new Plan, click [Sync to Drivepoint](/navigating-the-excel-add-in/core-functions-of-the-drivepoint-add-in/sync-to-drivepoint)
6. Navigate to the main Plans page to see the differences in values between different Plans
7. Visualize and compare your plans in the Drivepoint Web App. See how to do that [here](https://docs.drivepoint.io/help/using-the-web-app/plans/best-practices).&#x20;

{% hint style="info" %}
Plans can best be compared with the table in the Main Plans page or through the Visualize feature. Learn more here.&#x20;
{% endhint %}


# Import Plans to Compare in SmartModel™

In order to view plans in the "Compare Plans" or other Variance Review tabs in the SmartModel™ you can import plans to compare them to perform a mid month or end of month variance review.

### How do I import plans?

1. Click on "Import Plans" in the Add-In

<figure><img src="https://551491405-files.gitbook.io/~/files/v0/b/gitbook-x-prod.appspot.com/o/spaces%2F6vYp0ryZvSoKCyDwCTG9%2Fuploads%2FhNtGFXae0EUxeXE3EkdX%2Fimage.png?alt=media&amp;token=3ff2632d-e56f-4707-aae8-a4cf5cf3b136" alt="" width="174"><figcaption></figcaption></figure>

1. Select the plans you want to import
2. Click on "Import and Save" at the bottom of the screen

<figure><img src="https://551491405-files.gitbook.io/~/files/v0/b/gitbook-x-prod.appspot.com/o/spaces%2F6vYp0ryZvSoKCyDwCTG9%2Fuploads%2FtUsu7eyOnyVjWrfjtC6U%2Fimage.png?alt=media&amp;token=693c0540-a48c-477c-9c3d-a24c6d66fba0" alt="" width="175"><figcaption></figcaption></figure>

4. Navigate to the blue "Compare Plans" tab in the SmartModel™
5. Select the recently imported plan to view the variance

<figure><img src="https://551491405-files.gitbook.io/~/files/v0/b/gitbook-x-prod.appspot.com/o/spaces%2F6vYp0ryZvSoKCyDwCTG9%2Fuploads%2FjuMRq0oDLT4ObwcGuNmM%2Fimage.png?alt=media&amp;token=5a82add5-94a3-4127-8579-309bbe2a3725" alt="" width="188"><figcaption><p>Compare Plans tab in the SmartModel™</p></figcaption></figure>

### How do I delete plans from the drop-down?

1. Right click on any tab
2. Select "Unhide" from the Excel menu
3. Find the F-tab with the plan name you would like to delete
4. Unhide it&#x20;
5. Delete the tab
6. Click on "Import Data"
7. Select one plan to import
8. Every other plan that is not selected will get deleted from the drop-down menu

*For SmartModel™ expert users: you can also find the I-meta data tab and delete the column with the plan name to remove plans from the drop-down menu.*&#x20;


# FAQ on the new Add-In

Some common questions we have received from beta customers and their answers.

<details>

<summary>Help!? I need to re-add the Add-In every single time?</summary>

We sometimes observe this is the case when you are not signed in properly with your Excel account or if your company does not have a Microsoft Excel 365 license. [Reach out](/help-1) to our team with any questions in terms of which email address we should add to your Drivepoint account so that you don't have to re-add the Drivepoint Add-in every time.&#x20;

</details>

<details>

<summary>What is sync and why do I have to do it?</summary>

Syncing pushes all of your progress from the Excel file into the Drivepoint Cloud. This currently does not happen automatically so we rely on you to press "Sync" after you have completed your working session. Learn more [here](/navigating-the-excel-add-in/core-functions-of-the-drivepoint-add-in/sync-to-drivepoint).&#x20;

</details>

<details>

<summary>What are all of the timestamps in the Add-in? </summary>

Drivepoint is not fully synced to raw data meaning that YOU have to import fresh data into your files before a roll forward or a working session.&#x20;

The Drivepoint Data Warehouse (DWH) grab raw new data from sources every couple of hours. You can see the freshest data available for you to import into your model from the Drivepoint cloud as "Freshest data available in the Data Warehouse".&#x20;

When we talk about last time this data source was imported into the model it is the timestamp of when you or your colleague have pressed the "Import" button to get data into the mode.&#x20;

Learn more [here](/navigating-the-excel-add-in/core-functions-of-the-drivepoint-add-in/import-data).&#x20;

</details>

<details>

<summary>Where does the freshly imported data live?</summary>

Newly imported data lives in the "R-" tabs in your Excel files. For example:&#x20;

* R-GL: is the general ledger and therefore the raw data import sheet for your financial information that maps throughout the file
* R- DTC Product Sales Mix: is the import tab for Shopify product sales mix actuals and information.&#x20;

If you import fresh data, the model should automatically update with the fresh data via Lookup formulas BUT it is always good to double check. [Reach out to our team](/help-1) if you want to learn more.&#x20;

</details>

<details>

<summary>What does promoting a live model mean again?</summary>

This essentially indicates to you, your team and us which Excel file you are viewing as your source of truth and source of actuals. If you decide to promote a new Excel file as the new live model then the Drivepoint Tech will grab actuals from that new file for all financial reports moving forward (and retroactively).&#x20;

</details>

<details>

<summary>How can I delete old plans?</summary>

In the Web-App, click on the three dots of the row of the plan you would like to delete and then "archive" to remove them from the UI.&#x20;

</details>


# Plans

Plans are a fundamental concept in Drivepoint. This section provides an overview of plans. Next, we wil l dive into how to use them.

A plan is a saved snapshot of your model at a moment in time, including all your assumptions, all the historical data, and all the outputs of the model. Importantly, it also contains your commentary about the plan, via its name and description (see our tips for naming plans below). Plans are one of the most powerful features of your SmartModel™️.&#x20;

An easy way think about plans is that they provide much the same functionality as a "Save As" option that you're used to with traditional documents. You give the plan a different name, just as you would the new file, and you can change the original without making changes the new one. Once you've saved a plan, it's stored safely in the cloud. The goal is that you can easily create and iterate on plans - both what-if's and rolling forecasts. Then, you can compare those plans to each other and your actual performance to better understand your business and find opportunities for growth.

### **Key Points of Understanding:**

* A plan is a point-in-time snapshot.
* Plans are the result of combining data
* Plans contains several critical pieces of information:
  1. Snapshot of the business as it currently exists (historical data)
  2. Forward picture of what the business could do given the available data and a set of assumptions;
  3. Complete record of the assumptions used to generate the plan;
  4. Your commentary about the plan and its purpose (name and description)
  5. Once saved, plans CAN be edited

### Quick links to navigate Plans:&#x20;

{% content-ref url="/pages/dS4NAOOBScDVqhmI5vRj" %}
[Saving a Plan](/navigating-the-excel-add-in/plans/saving-a-plan)
{% endcontent-ref %}

{% content-ref url="/pages/l68bhQ0BVESQxy8Cc1T9" %}
[Viewing saved Plans](/navigating-the-excel-add-in/plans/viewing-saved-plans)
{% endcontent-ref %}

{% content-ref url="/pages/JFz4BbfMIVz1VTjt45ca" %}
[Reloading saved Plans](/navigating-the-excel-add-in/plans/reloading-saved-plans)
{% endcontent-ref %}

{% content-ref url="/pages/n6yy4MK1SRNNH5cNUSgt" %}
[Can I edit Plans?!](/navigating-the-excel-add-in/plans/can-i-edit-plans)
{% endcontent-ref %}


# Saving a Plan

Use this guide to save a plan and understand the typical use case for saving plans.

{% hint style="info" %}
**Quick Guide on saving plans (once you changed assumptions and are ready to save plans)**

1. Select the Drivepoint Excel Add in menu
2. Click the **Save Plan** icon in the Excel ribbon
3. Choose a descriptive name for your plan.
4. Enter a description of the plan.
5. Click **Save**
   {% endhint %}

## **Why should I save a plan?**

Drivepoint users save plans for a variety of reasons:&#x20;

1. "What if my CAC increases by $10 in the next half year?"
2. "What if my split among subscription and one-time users would shift to 50% / 50%?"
3. "My supplier is increasing prices. How does a COGS change increase my EBITDA in Q3 this year?

You can answer all of these questions by changing the changes in assumptions and playing around with it to perform analyses.&#x20;

### Here is an example...

As the CEO of a chocolate bar company called Choco-Shock, I am offering chocolate bar boxes on my website either for a one-time purchase or as a monthly subscription box. I have seen that over the past months, it has been harder to acquire users and I would like to analyze what happens if my CAC increases by $5 for the next 6 months.&#x20;

1. I navigate to the Drivepoint SmartModel™️ and open the Excel Add-In
2. I click on "**Plans**" in the Add-in ribbon menu
3. I click on "**New Plan**" on the top right corner
4. I set the name as: "Forecast 02/29/2024" and the description as: "Status quo of the forecast of 02/29. Saving this plan to load it back after I perform CAC analyses."
5. Click "**Save**"

**Nice! Now I am able to actually play around with the CAC numbers in the model:**

6. I navigate to the yellow DTC-Acquisition tab
7. I increase my CAC for the next 6 months by $5 by editing the cells directly
8. I can see the effects on my financial metrics and take a note to discuss with my Marketing team
9. I save the plan to retrieve it during my meeting with the Marketing team by clicking on the Drivepoint Excel Add-In again
10. I click on "**Plans**" in the Add-in ribbon menu
11. I click on "**New Plan**" on the top right corner
12. I set the name as: "CAC Increase by $5 (March 2024) and the description as: "Analysis of a CAC increase of $5 to evaluate Marketing strategy changes next month."
13. I click "**Save**"

❗️ **I am not done yet!!!**

14. I click into "Plans"
15. I navigate to my "Forecast 02/29/2024" plan and select the "..." menu
16. I click on "Load plan"

**Now I am done**🎉. Anyone else in my team can click into the model and have the "current" assumptions back.&#x20;


# Viewing saved Plans

Use this guide to compare and view existing saved plans.

### **The easiest way to compare existing saved plans is in the Drivepoint platform:**

1. Navigate to the [Drivepoint Platform](https://app.drivepoint.io/)
2. Click on "Plans" on the left sidebar
3. Select and compare various saved plans

#### **Would you like to change the name or description of saved plans?**

1. Click on the "..." in the "**Plans**" webpage
2. Select "Edit" to change names or descriptions

#### **Would you like to clean up the "Plans" View?**

1. Click on the "..." in the "**Plans**" webpage
2. Click "**Archive**" to remove any plan **(❗️cannot be undone)**

{% hint style="info" %}
**Secret Tip**🤫: You can also see a list of all plans in the Excel Add-In

1. Select the Drivepoint Add in menu
2. Click the **View Plans** icon in the Excel Ribbon
3. View your saved Plans and summaries. You may need to scroll to see all your saved plans.
   {% endhint %}


# Reloading saved Plans

Use this guide to take a saved Plan and change the view of your SmartModel™️.

{% hint style="warning" %}
**Warning:** Loading assumptions from a saved plan will overwrite the current assumptions in your working model. You may want to save your current working copy as a plan before you continue. Please reference '[saving a plan](/navigating-the-excel-add-in/plans/saving-a-plan)' and the example use case.
{% endhint %}

As a best practice scenario, especially when you have multiple users working in the model, it is good practice to save the current version of the SmartModel™️ as a plan before making any changes. In that way, you can very easily go back to the "start" when you have finished your analyses in the SmartModel™️.&#x20;

Assuming you have done some CAC analyses, here is how you go back to the initial version:

1. Select the Drivepoint Excel Add in menu item
2. Click the "**View Plans"** icon in the Excel Ribbon
3. Locate the plan you want to reload assumptions from and click on **Load Assumptions from this Plan** (it's a blue button near the bottom of the plan summary card).
4. Choose which assumptions you want to reload *(in other words: which tabs you would like to reload)*

{% hint style="info" %}
You are able to select all tabs (especially useful if you have made a lot of changes or you are not quite sure which tabs you touched) or if you analysed just a few metrics you can select the tabs that you want to update. Either case works, you might just have to wait a moment if you selected all tabs.&#x20;
{% endhint %}

5. Wait for the operation to complete (this can take a while - no need to panic🙏)

If your plan is not saving or you receive any issues, please contact us immediately to resolve the issue

{% content-ref url="/spaces/GWP01Uan8w7wePRkCAQS/pages/JIL9p5hP3IZ9pTXZcuqP" %}
[Contact Us](/help-1)
{% endcontent-ref %}


# Can I edit Plans?!

With the September update you are able to update plans soon - stay tuned!

Unfortunately, currently Drivepoint does not offer an editing functionality to plans. However, we are working on a feature like this. If you have an urgent need to enable this, please help us accelerate the feature in the roadmap by sending us a request [here](https://share.hsforms.com/1Q7G4d9OeSJ2psS5TW9jzsA3jy5q).&#x20;

**💡 Pro Tip - Another way to 'edit' a Plan:**

Since plans can't be edited directly, the way to go about this in Drivepoint is to reload the assumptions from a saved plan into your working model, make the changes you want, and then save a new plan.

To reload from a saved plan, navigate [here](/navigating-the-excel-add-in/plans/reloading-saved-plans).&#x20;


# Model Roll Forward

Rolling the model forward means to replace forecasts with actuals. Click on one of the links below to learn how to roll your model forward once the books for the month are closed.

## Step by Step Guide

* In the Drivepoint Add-in, click on “Roll Forward"
* Select the month that you are trying to close (last month of actuals)
* Select all of the tabs you want to roll forward. We strongly recommend to roll forward ALL tabs
  1. 💡 We include all tabs with proper Drivepoint formatting (e.g. Date Spine in Row 3, etc) in the list. **Reach out to** [**support**](https://docs.drivepoint.io/help/help-1) **if you want to learn more.**&#x20;
  2. 💡You can only roll forward some of the tabs (e.g. DTC) if you want to get a partial view of the *how the month is shaking out*
* Confirm your selection
* Drivepoint will now roll the model forward by grabbing the fresh data and converting the month from forecast to actuals
* Upon completion, you can navigate to M-monthly and see whether in Row 3 the label has changed from “Forecast” to “Actual”

## Links

{% content-ref url="/pages/F700ByWym9I41A6KXKl4" %}
[Help! I accidentally rolled forward?!](/navigating-the-excel-add-in/core-functions-of-the-drivepoint-add-in/model-roll-forward/help-i-accidentally-rolled-forward)
{% endcontent-ref %}


# Help! I accidentally rolled forward?!

No worries - we know it happens.

## Option 1: Select an older version in Excel History

1. In Excel, click on "File"
2. Click on "Info"
3. Click on "Version History"
4. Select the previous or an older version of your SmartModel™

If there was a significant time delay or other team members have already made significant changes to the SmartModel™, you are also able to roll back your model. Click on the links below to learn more.

## **Option 2: Roll Model Back**

1. Open the Drivepoint Add-In
2. Click on "Roll Model Forward"
3. Click on "Roll Back" on the bottom of the screen
4. Select the date you would like to roll the model back to
   1. *💡 The date of current actuals is highlighted. You will need to select a PREVIOUS month to roll back actuals to forecasts.*&#x20;
5. Click "Model Roll Back"
6. View all selected tabs of your model by default
   1. *💡 Partial roll back: only select the tabs you want to roll back specifically*
7. Click "Roll Model Back"
8. Your model will now get rolled back


# Permissions

Drivepoint handles permissions for all plans and the live model via Sharepoint.

{% embed url="<https://www.loom.com/share/f915f0085c4a487094b05e4f7cece422?sid=f544ad9a-025a-4f8a-bd71-51649a71cfe9&t=66>" %}
Start the video at 1:06 if you got here from the Web-App
{% endembed %}

### Quick Links

{% content-ref url="/pages/LgU7nSCnwlXqhQ2KKZfC" %}
[Broken mention](broken://pages/LgU7nSCnwlXqhQ2KKZfC)
{% endcontent-ref %}

{% content-ref url="/pages/M7IZ64ZG9ltBPxiuuzpy" %}
[Broken mention](broken://pages/M7IZ64ZG9ltBPxiuuzpy)
{% endcontent-ref %}

{% content-ref url="/pages/nE58BoIkc2hiMkqiNTzT" %}
[Creating and Managing Groups](/navigating-the-excel-add-in/permissions/creating-and-managing-groups)
{% endcontent-ref %}


# Creating and Managing Groups

Let's say your demand planning model lives in Drivepoint. You want to give the team access to that folder but not the main Financial Model. Let's create a group with access to just one folder.

{% hint style="info" %}
This article is divided into three sections:&#x20;

* [Creating groups](#creating-groups)
* [Granting a group access to a specific folder](#adding-a-group-to-viewing-a-specific-folder)
* [Managing groups](#managing-groups)
  {% endhint %}

## Creating groups

1. Open your Sharepoint company site
2. Click on "Documents" on the top left

<figure><img src="https://551491405-files.gitbook.io/~/files/v0/b/gitbook-x-prod.appspot.com/o/spaces%2F6vYp0ryZvSoKCyDwCTG9%2Fuploads%2Fnd2sq8ukCYihgvCcZJn8%2Fimage.png?alt=media&amp;token=8e3da5bf-906c-41be-b056-5cd68a659533" alt=""><figcaption></figcaption></figure>

3. Click into the "\_\_plans\_\_" folder&#x20;

{% hint style="info" %}
Our engineering team created the \_\_plans\_\_ folder structure in order to effectively move data between files. Please do NOT delete this folder.&#x20;
{% endhint %}

3. Click on "Share"

<figure><img src="https://551491405-files.gitbook.io/~/files/v0/b/gitbook-x-prod.appspot.com/o/spaces%2F6vYp0ryZvSoKCyDwCTG9%2Fuploads%2Fb3BPZ7oHWS1khT0y6AcN%2Fimage.png?alt=media&amp;token=cceb6009-bfa8-433c-af97-402fafb7087a" alt="" width="563"><figcaption></figcaption></figure>

4. Click on the person icons on the bottom left of the pop-up modal

<figure><img src="https://551491405-files.gitbook.io/~/files/v0/b/gitbook-x-prod.appspot.com/o/spaces%2F6vYp0ryZvSoKCyDwCTG9%2Fuploads%2FQSy7ZVbsWG4rttPzvF0Q%2Fimage.png?alt=media&amp;token=844dd572-32cc-4322-8161-c13f9b13b060" alt="" width="563"><figcaption></figcaption></figure>

5. Click on the three dots "..." on the top right and on "Advanced Settings" of the pop up modal

<figure><img src="https://551491405-files.gitbook.io/~/files/v0/b/gitbook-x-prod.appspot.com/o/spaces%2F6vYp0ryZvSoKCyDwCTG9%2Fuploads%2Fa2GqCzyeKtIiYMYiMQFU%2Fimage.png?alt=media&amp;token=c7c829ca-9f20-4041-8040-38b0eaa39322" alt="" width="375"><figcaption></figcaption></figure>

{% hint style="info" %}
You have now landed on the main Sharepoint Group permission console. From here we can create and manage groups. The default groups are Members/Visitors/Guests. We recommend to not manage them since they are the default Sharepoint settings. \
Click [here](broken://pages/M7IZ64ZG9ltBPxiuuzpy) if you would like to know how to add someone to the main Sharepoint site.&#x20;
{% endhint %}

6. Click on "Manage Parent Permissions"

<figure><img src="https://551491405-files.gitbook.io/~/files/v0/b/gitbook-x-prod.appspot.com/o/spaces%2F6vYp0ryZvSoKCyDwCTG9%2Fuploads%2FjcWIkkjPdIdfu4bG5WfZ%2Fimage.png?alt=media&amp;token=74701e29-ff6f-443d-9a8b-76a2b3def224" alt=""><figcaption></figcaption></figure>

7. Click on "Create Group" on the top left

<figure><img src="https://551491405-files.gitbook.io/~/files/v0/b/gitbook-x-prod.appspot.com/o/spaces%2F6vYp0ryZvSoKCyDwCTG9%2Fuploads%2Fj0KYzrkz5MajaCclbmBw%2Fimage.png?alt=media&amp;token=d889b700-fcb5-428c-b905-dc282343896c" alt=""><figcaption></figcaption></figure>

8. Fill out all of the information to create your group *(CAREFUL WITH THE LAST SECTION - see below)*

<figure><img src="https://551491405-files.gitbook.io/~/files/v0/b/gitbook-x-prod.appspot.com/o/spaces%2F6vYp0ryZvSoKCyDwCTG9%2Fuploads%2FbVcqG6gv8wfxoE1Xezt5%2Fimage.png?alt=media&amp;token=1d728065-c495-4842-87f0-204a56e06f3c" alt=""><figcaption></figcaption></figure>

9. For the last section, leave ALL OF THE BOXES UNCHECKED. If you do not, you are giving this group Sharepoint-wide access, meaning they can read or write all files.&#x20;

<figure><img src="https://551491405-files.gitbook.io/~/files/v0/b/gitbook-x-prod.appspot.com/o/spaces%2F6vYp0ryZvSoKCyDwCTG9%2Fuploads%2FUdlXlhaAjmD1GJB63N64%2Fimage.png?alt=media&amp;token=487e91bf-0943-4a63-91a2-beb468d5c0e3" alt=""><figcaption></figcaption></figure>

10. Click on "Create"

<figure><img src="https://551491405-files.gitbook.io/~/files/v0/b/gitbook-x-prod.appspot.com/o/spaces%2F6vYp0ryZvSoKCyDwCTG9%2Fuploads%2FiiJ965sS71SdxQyD9swX%2Fimage.png?alt=media&amp;token=c5c09566-3259-4909-9200-8801dc80b0de" alt=""><figcaption></figcaption></figure>

11. You can now add users to the group (if you did not do it during the group creation)

{% hint style="info" %}
You are only able to add people that do **not** have Sharepoint-wide permissions.&#x20;
{% endhint %}

<figure><img src="https://551491405-files.gitbook.io/~/files/v0/b/gitbook-x-prod.appspot.com/o/spaces%2F6vYp0ryZvSoKCyDwCTG9%2Fuploads%2FgPLoTwnAnXV768oJSM1R%2Fimage.png?alt=media&amp;token=0d086d41-ee92-4617-b27c-f3957f3fbe51" alt="" width="563"><figcaption></figcaption></figure>

12. Congrats - you now created a group

## Granting a group access to a specific folder

1. Open the Documents section in Sharepoint again

{% hint style="info" %}
There is also a Documents button from the permissions management console - see screenshot:

![](https://551491405-files.gitbook.io/~/files/v0/b/gitbook-x-prod.appspot.com/o/spaces%2F6vYp0ryZvSoKCyDwCTG9%2Fuploads%2FyMBQDl5Ges2O8nom4WO9%2Fimage.png?alt=media\&token=ea1397e2-7290-481d-a7ea-5e712aca0b53)
{% endhint %}

2. Click on "Share" in the folder that you would like to share with a group

<figure><img src="https://551491405-files.gitbook.io/~/files/v0/b/gitbook-x-prod.appspot.com/o/spaces%2F6vYp0ryZvSoKCyDwCTG9%2Fuploads%2FUdoz3K8jX05PjqHnH6Zp%2Fimage.png?alt=media&amp;token=4ca8b178-b33e-40a9-859e-2878e3ff257e" alt=""><figcaption></figcaption></figure>

3. Type in the group that you want to share the folder with

<figure><img src="https://551491405-files.gitbook.io/~/files/v0/b/gitbook-x-prod.appspot.com/o/spaces%2F6vYp0ryZvSoKCyDwCTG9%2Fuploads%2F6Z4mlsDKFPPbCQzBrPwK%2Fimage.png?alt=media&amp;token=da9685a3-18bf-467a-918d-58b5ee5caea1" alt="" width="563"><figcaption></figcaption></figure>

4. Click "Send"&#x20;
5. Congrats - you shared a folder (+ its sub-folders) with a group🎉

## Managing Groups

**Option 1**

1. Click [here](https://myaccount.microsoft.com/groups/groups-i-own) *(*[*https://myaccount.microsoft.com/groups/groups-i-own*](https://myaccount.microsoft.com/groups/groups-i-own)*)*
2. Add or remove users to the groups that you own

**Option 2**

1. Click into Advanced Settings when sharing a folder (follow all steps until Step 6 [here](#folder-specific-groups))
2. Click into the individual group that you want to add users to
3. Add or remove users

<figure><img src="https://551491405-files.gitbook.io/~/files/v0/b/gitbook-x-prod.appspot.com/o/spaces%2F6vYp0ryZvSoKCyDwCTG9%2Fuploads%2F0qniZ8BGRKTzGPtoX39H%2Fimage.png?alt=media&amp;token=767927be-5723-49ef-9422-870688a0d8ef" alt=""><figcaption></figcaption></figure>

## Deleting Groups

1. Open the Sharepoint Group page
2. Hover over "Settings" in the top header
3. Click on "Group Settings"

<figure><img src="https://551491405-files.gitbook.io/~/files/v0/b/gitbook-x-prod.appspot.com/o/spaces%2F6vYp0ryZvSoKCyDwCTG9%2Fuploads%2Fkcvu57eN20gloKJYBuSZ%2Fimage.png?alt=media&amp;token=833b4302-9b8d-41df-99fc-16d3108df353" alt=""><figcaption></figcaption></figure>

4. Click on "Delete" on the bottom right of the screen

<figure><img src="https://551491405-files.gitbook.io/~/files/v0/b/gitbook-x-prod.appspot.com/o/spaces%2F6vYp0ryZvSoKCyDwCTG9%2Fuploads%2FD6QlQgvDRdxIedYnPLHm%2Fimage.png?alt=media&amp;token=84981771-4a76-4db4-a5a7-36e340f3222a" alt=""><figcaption></figcaption></figure>

We are also still learning how to best navigate Sharepoint permissions. If you have any questions, feedback or better options of managing groups, please do not hesitate to reach out to us.&#x20;

{% content-ref url="/spaces/GWP01Uan8w7wePRkCAQS/pages/JIL9p5hP3IZ9pTXZcuqP" %}
[Contact Us](/help-1)
{% endcontent-ref %}

{% content-ref url="/spaces/GWP01Uan8w7wePRkCAQS/pages/jMHTotZWbk3hSGAmSneE" %}
[Provide Feedback](/help-1/provide-feedback)
{% endcontent-ref %}


# Removing the old Add-In "Drivepoint Legacy"

Step-by-step guide on how to remove the old Add-In

1. In Excel, click on "Home" and then on "Add-ins" on the far right of the screen

<figure><img src="https://551491405-files.gitbook.io/~/files/v0/b/gitbook-x-prod.appspot.com/o/spaces%2F6vYp0ryZvSoKCyDwCTG9%2Fuploads%2FRDvNT73oHO0FmW1K6jLF%2Fimage.png?alt=media&amp;token=bbc6ba20-5076-42a0-8e27-4dd0fccaecaf" alt=""><figcaption></figcaption></figure>

2. Click on "More Add-Ins" on the bottom right

<figure><img src="https://551491405-files.gitbook.io/~/files/v0/b/gitbook-x-prod.appspot.com/o/spaces%2F6vYp0ryZvSoKCyDwCTG9%2Fuploads%2FcdXFJc3ItlKzAVp6IPH2%2Fimage.png?alt=media&amp;token=d389e86c-74a3-46a9-a654-fc8c4946fa54" alt="" width="184"><figcaption></figcaption></figure>

3. Click on "My Add-Ins" on the top left of the pop-up

<figure><img src="https://551491405-files.gitbook.io/~/files/v0/b/gitbook-x-prod.appspot.com/o/spaces%2F6vYp0ryZvSoKCyDwCTG9%2Fuploads%2FbO0fP2qVtlV9rMz1Kfz4%2Fimage.png?alt=media&amp;token=4bfd03fc-2208-4228-8a33-3281ed0460e1" alt="" width="188"><figcaption></figcaption></figure>

4. Hover over Drivepoint Legacy -> the Add-In to be removed
5. Click on the three dots and click "Remove"

<figure><img src="https://551491405-files.gitbook.io/~/files/v0/b/gitbook-x-prod.appspot.com/o/spaces%2F6vYp0ryZvSoKCyDwCTG9%2Fuploads%2Fm8zwzhdQe4lH46VMtDSo%2Fimage.png?alt=media&amp;token=2d3d769c-33dd-4ded-9f22-a9078185a6c6" alt=""><figcaption></figcaption></figure>

6. Confirm your selection in the Microsoft pop-up
7. Success - you removed the old Drivepoint Add-In🎉


# Previous Add-In Version

You are currently on an old Version of the Drivepoint Add-In.

We have upgraded our Add-In product and technology in Q4 2024. Please download the newest version to make use of Drivepoint's core product features AND much more🎉

**See below how to download the newest version of the Drivepoint Add-In**

{% content-ref url="/pages/m7lCEAVLo6WFUBvB4RHv" %}
[Installing the Drivepoint 2.0 Add-In](/navigating-the-excel-add-in/installing-the-drivepoint-2.0-add-in)
{% endcontent-ref %}

{% content-ref url="/pages/timiQXYWhAppeQEceJNA" %}
[Core Functions of the Drivepoint Add-In](/navigating-the-excel-add-in/core-functions-of-the-drivepoint-add-in)
{% endcontent-ref %}

{% content-ref url="/pages/bNvIoY7KEnV18acupE46" %}
[FAQ on the new Add-In](/navigating-the-excel-add-in/core-functions-of-the-drivepoint-add-in/faq-on-the-new-add-in)
{% endcontent-ref %}


# Reports

Learn how to access reports and how you can easily customize and generate reports

Whether it is to pull screenshots for your next board meeting or send monthly graphs to investors, you can set all of that up in the new Reports tab in Drivepoint:&#x20;

1. Navigate to [Drivepoint](https://app.drivepoint.io/)
2. Click on "Reports" in the sidebar
3. Click within any bundle to access reports
4. Once you are within a report, you can use the field toggles to customize each individual reports.&#x20;

Check out the video on the next page to see how to navigate and customize reports.&#x20;


# Drivepoint Reports

We continuously update our reporting suite with new reports. Check it out every week to see featured reports and bundles!

The Drivepoint Reports are a useful resource to view, analyze, export and schedule all kinds of reports to you and your colleagues.&#x20;

Reports can be found in bundles or in the "All Reports" section *(see toggle on the top of the reports page).*&#x20;

* Most popular bundle: **DTC Customer Cohort** (includes retention, LTV and cohorted financials report)
* Most popular report: **LTV by Dimension report** (can be found in the DTC AND Amazon Cohort Analysis bundle)

### **⭐️Wow - how do favorite reports to my sidebar for easy access?!**

1. Click within a bundle
2. Navigate to the right of the row of the report you want to favorite
3. Click on the "..."
4. Click on "Favorite"
5. Voila - your favorite report should now be added to the sidebar🎉


# Video Training

Dive into our Video Training to understand Drivepoint Reports better

## Cohorted Financials Report&#x20;

*Available for all Sales channels*

{% embed url="<https://www.loom.com/share/0672dd37531d4d7db6479e296a9b4528>" %}
💡 We added chapters to this video so you can easily jump between sections
{% endembed %}

## DTC LTV/Retention by Dimension

*Available for all Sales Channels*

{% embed url="<https://www.loom.com/share/910a120768d14f7f815ff65b5f2008d4>" %}


# Build Your Own Reports

WIP


# Controls

Find definitions of each control section below. Let us know if we missed anything!

## FAQ

<details>

<summary>How do my cohorts automatically include the most recent cohort?</summary>

You can select a time range in the future to include recent months.&#x20;

Example: Today is September. I want to make sure March cohort is included in my 180 Days LTV report.&#x20;

You can just select Jan-Dec 2025 in the absolute date picker and every time you re-access the report in the future it will include the matured cohorts -> e.g. March next month. *Users can select months in the future to avoid having the problem of including future matured cohorts, as you described: They could also select Jan 2025 - Dec 2026 if they want.*

You could also create a relative lookback window if you don't want to look at YTD but the last 12 months maybe by selecting "Last 12 months" and then they will see Oct, Nov, Dec, Jan, Feb today and next month "March" (remove Oct), etc. So you basically create a relative lookback period that moves with time.

</details>

<details>

<summary>What are Breakdowns, Metrics and Filters?</summary>

### Breakdown

Segment to group your data into different categories.

### Metrics

Add an event to analyze. You can select one or multiple metrics depending on the report.

### Filters

Filter to include or exclude specific data.

</details>

{% content-ref url="/spaces/GWP01Uan8w7wePRkCAQS/pages/JIL9p5hP3IZ9pTXZcuqP" %}
[Contact Us](/help-1)
{% endcontent-ref %}


# Cohort Analysis

Reports included: Customer Retention, LTV by Dimension, Cohorted Financials and more.

## Definitions

* Cohorts are groups of customers who purchased your product(s) within the same month. The goal of this bundle is to uncover which months have been more lucrative for the business
* Customer lifetime value (LTV) is a measure of the average customer’s revenue generated over their entire relationship with a company. Learn more [here](https://www.netsuite.com/portal/resource/articles/ecommerce/customer-lifetime-value-clv.shtml).&#x20;

## Pro Tips

* You can sort columns by clicking on the header row

*💡1 click = sort descending, 2 clicks = sort ascending, 3 clicks = back to original*

* You can drag and drop columns in tables to compare them side by side

*💡 Your changes won’t be saved so once you navigate away, the table turns into its default again. Great for screenshots though!*

<br>


# Cohorted Financials

This report is derived by combining the financial information from the Drivepoint Smartmodel™️ and your Sales data (e.g. DTC Sales from Shopify or Amazon Sales from Amazon).

## Determining Contribution Profit <a href="#determining-contribution-profit" id="determining-contribution-profit"></a>

In order to calculate contribution profit per customer, the contribution margin pulled from the model is applied towards every single order that occurred within the same month. Since the contribution margin is not calculated per product, keep that in mind when using the `First Segment` filter that the average contribution margin from a month has been applied across **all products**.

## Determining Total Cost and Customer Acquisition Cost (CAC) <a href="#determining-customer-acquisition-cost-cac" id="determining-customer-acquisition-cost-cac"></a>

The report provides insights into key cost metrics, including **Direct Ad Spend** and **Total Marketing Spend**, which represent the investment required to acquire new customers.

**Total View**

When selecting the **Total** metric type, the report displays the absolute amount of **Direct Ad Spend** and **Total Marketing Spend** for each month. This allows for an analysis of overall spending trends without adjusting for customer count.

**Per Customer View**

When selecting **Per Customer**, the report divides these costs by the number of customers acquired in each month, providing an average cost per customer.

For instance, the direct ad spend for Jan. 2024 was $10,000 and the number of customers acquired in Jan. 2024 was 200; thus, the Blended Spend CAC (Customer Acquisition Cost) for the month was $50 (`$10,000 spend / 200 customers`). As a result, this calculation generalizes that 100% of the spend is towards customer acquisition, which Drivepoint has found to be close to true across a portfolio of companies.

Similar to the determination of contribution profit mentioned above, there is no attribution of the CACs to a specific segment. The marketing spend that acquires a customer is not determinant of the product the customer chooses to buy.

***Amazon can often experience a 14 day lag. Click below to learn more.***

{% content-ref url="/pages/N9BKbfVSxVucmF4yc5IK" %}
[Amazon Reports](/using-the-web-app/reports/amazon-reports)
{% endcontent-ref %}

## Definitions <a href="#definitions" id="definitions"></a>

**Metric Type:** This report allows you to analyze customer financial metrics in two different ways:

* &#x20;**Per Customer (Selected by Default):**\
  When the **Per Customer** option is selected, all financial metrics are divided by the **Cohort Size**, providing insights at an individual customer level.\
  Example: **Net Sales** is calculated as **Cumulative Net Sales / Cohort Size**.
* **Total:**\
  When the **Total** option is selected, financial metrics are displayed in absolute values without dividing by cohort size. This allows for an overall view of revenue and profitability trends across all cohorts.\
  Example: **Net Sales** in **Total** mode reflects the **total cumulative net sales** without normalization per customer.

***

* **Months Since First Purchase:** Calculated as calendar months from the date of the first purchase. Month 0 represents the partial calendar month in which the first purchase occurred. Month 1 and onward represent the full calendar months that follow.

*For instance, a customer was acquired in Jan. 2020. The Month 0 is representative of that first purchase and any purchases that followed within Jan. 2020. Month 1 would represent any purchases that took place in Feb. 2020, Month 2 would be Mar. 2020, Month 3 as Apr. 2020, and so on.*

* **Gross Sales:** Cumulative Gross Sales / Cohort Size
* **Net Sales:** Cumulative Net Sales / Cohort Size
* **Net Revenue:** Cumulative Net Revenue / Cohort Size

*The following metrics rely on financials being saved from the model to the data warehouse during a Save Plan action. If you see, for instance, a Blended Spend (CAC) at $0 for a Cohort Month, you may need to save a plan.*

* **Contribution Profit :** Cumulative Contribution Profit / Cohort Size
* **Blended Spend:** Direct Ad Spend / Cohort Size
* **Fully Loaded Spend:** Total Marketing Spend / Cohort Size
* **Contribution Profit  Less Blended Spend:** Contribution Profit  - Blended Send / Cohort Size
* **Contribution Profit  Less Fully Loaded Spend:** Contribution Profit  - Fully Loaded Spend / Cohort Size

*💡Example: After 4 months, the Contribution Profit Less Fully Loaded Spend  (aka without any direct costs related to acquiring a customer) of customers who bought a subscription in Feb-23 is $14. After 10 months their Contribution Profit without fully loaded Spend  is $20.*

<br>


# Customer Retention

This data is pulled from Sales data (e.g. DTC Sales from Shopify or Amazon Sales from Amazon).

## Definitions <a href="#definitions" id="definitions"></a>

*In order to focus on the customer retention after the first purchase, this report completely excludes the first purchase from any of the calculations. As a result, any Day 0, Week 0 or Month 0 Since First Purchase displayed that would always be 100% will instead represent the percentage of customers that made a returning purchase within the same period in which they made the first purchase.*

**Customer Retention:** Cohorted by when they made their first purchase (*Cohort Interval*), the number of customers that made a returning purchase divided by the number of customers from the cohort (*Cohort Size*).

**Cohort Interval:** This is a control available in the *Filters* menu with the possible options of *Quarter, Month*, *Week*, and *Day*. Each option groups first-time customers together into cohorts based on the interval selected. For instance, a customer that makes their first purchase on January 15th, 2024 is cohorted into Q1 2024 (*quarter*), Jan-24 (*month*), (*week of*) Jan 14, 2024, and Jan 15, 2024 (*day*).

**Interval Since First Purchase:** This is a control available in the *Filters* menu with the possible options of *Month*, *Week*, and *Day*. Each option calculates the calendar distance since the first purchase.&#x20;

*As an example, let's assume we selected Month and we're looking at customers acquired in Jan. 2020. The Month 0 is representative of any purchases that followed within Jan. 2020. Month 1 would represent any purchases that took place in Feb. 2020, Month 2 would be Mar. 2020, Month 3 as Apr. 2020, and so on.*

***Amazon can often experience a 14 day lag. Click below to learn more.***

{% content-ref url="/pages/N9BKbfVSxVucmF4yc5IK" %}
[Amazon Reports](/using-the-web-app/reports/amazon-reports)
{% endcontent-ref %}

## Pro Tips & Tricks

1. View the performance of your previous 12 month cohorts in a graph and table.
2. Hovering over the graph will show you the percentage of customers acquired that made a returning purchase broken down per month.

*💡Example: 5.1% of customers who bought their first product in October-23 also purchased a product in the following month (November-23). Whereas 6.1% of customers who bought their first product in May-23 purchased a product in the following month (June-23)*

4. Toggle between different segments to uncover further insights (i.e.. Subscription vs. Non-Subscription)

*💡No segments specified? Talk to your Drivepoint rep or contact us*

5. Toggle between different timeframes to hone in on specific cohorts.
6. Export the graph and table by clicking the arrow button in the top right.


# LTV/Retention by Dimension

This report is derived from your Sales data (e.g. DTC Sales from Shopify or Amazon Sales from Amazon).

## Definitions <a href="#definitions" id="definitions"></a>

**Cohort Start Date:** This filter defines the period in which the customers made their first purchase. By default, this report is set to a period from two years ago to one year ago so that we use a large cohort that has aged exactly one year.

**Cohort Dimension:** Pick the dimension you would like to compare LTVs or retention between. For instance, if you select "First Order - Product Title", you'll receive a cohorted comparison over time of each product title purchased on the first order in terms of the metric you select (e.g. Customer Retention).

**Interval Since First Purchase:** This is a control available in the *Filters* menu with the possible options of *Month*, *Week*, and *Day*. Each option calculates the calendar distance since the first purchase.&#x20;

Metrics:

* **Customer Retention:** `Returning Customers / Cohort Size`
* **Gross LTV:** `Cumulative Gross Sales / Cohort Size.`
* **Net Sales LTV:** `Cumulative Net Sales / Cohort Size`&#x20;
  * `Net Sales = Gross Sales - Discounts - Returns`
* **Net Revenue LTV:** `Cumulative Net Revenue / Cohort Size`
  * `Net Revenue = Net Sales + Taxes + Shipping`

*The below metrics utilize a blend of transactional data and financial data from the SmartModel. These metrics include an **asterisk (\*) as a caveat** to their use in this report due to how they're constructed. These are constructed by applying the SmartModel's monthly actuals on contribution margin to every order that occurred within the same month and by applying monthly marketing spend actuals to every **first-time** order within the same month.*&#x20;

*As such, drilling down deep to a specific product, for instance, may not generate a true LTV for that product, but will allow the user to get an estimate at that level using average numbers sourced from the SmartModel. All of the metrics listed above (e.g. Net Revenue LTV), however, are true to any combination of filters or groupings since we purely use transactional data for those.*

* **Contribution Profit LTV\*:** `Cumulative Contribution Profit / Cohort Size`&#x20;
  * `Contribution Profit = Contribution Margin * Net Revenue`
* **Contribution Profit LTV Less Blended CAC\***: `Contribution Profit LTV - (Direct Ad Spend / Cohort Size)`
* **Contribution Profit LTV Less Fully Loaded CAC\***: `Contribution Profit LTV - (Total Marketing Spend / Cohort Size)`

## Constructing LTV and Retention Curves <a href="#definitions" id="definitions"></a>

This report only outputs LTVs or Retention Rates of *n* **Intervals Since First Purchase** such that every customer within the cohort would've had a chance to purchase up through the very last **Interval Since First Purchase**.&#x20;

*Let's dig into that further...*

When opening the report for the first time, it will default to a **Cohort Start Date** range between two years ago and one year ago. As a result, the report will pull LTVs of a length exactly equal to one year. The report will also default to using *Months* as the **Interval Since First Purchase**. This means that, for every month represented in this report, every customer in the cohort would've have a chance to make a returning purchase from Month 0 all the way to Month 12.&#x20;

So if you were to look at *Days* **Intervals Since First Purchase** and set the **Cohort Start Date** range to, say, six months ago to 15 days ago, the LTVs outputted would only be a length equal to 15 days. This is because we're only constructing LTVs such that every customer has had the same length of time to make a returning purchase. (The customers who were acquired 15 days ago have only had 15 days where they could've made a returning purchase.)

***Amazon can often experience a 14 day lag. Click below to learn more.***

{% content-ref url="/pages/N9BKbfVSxVucmF4yc5IK" %}
[Amazon Reports](/using-the-web-app/reports/amazon-reports)
{% endcontent-ref %}

## Pro Tips & Tricks

1. Make sure to set the Cohort Start Date to a range of dates in the past. &#x20;
2. View the performance by cohort of your previous 365 days in a graph and table.
3. Hovering over the graph will show the customer lifetime value by a specific segment.

*💡Example: After 21 days, the net revenue customer lifetime value of customers who bought a subscription in Feb-23 is $51. After 250 days their net revenue customer lifetime value is $63.*

<br>


# N-Day LTV

A pivoted way version of Cohorted Financials such that LTV and CAC can be viewed as a trend over time.

*This report represents the typical way that investors like to look at LTV to understand if a business is improving, stagnant or declining in terms of its ability to generate more value out of the customers it acquires since inception.*

## Definitions

<table><thead><tr><th>Name</th><th width="124">Type</th><th>Definition</th></tr></thead><tbody><tr><td><strong>Days Since First Purchase</strong></td><td>Dimension</td><td>Calculated as the number calendar days from the date of the first purchase, this dimension defines each series on the chart and each column within the table of this report. <br><br><em>Depending on the <strong>Cohort Months</strong> filter, this report can output Days 0, 30, 45, 60, 90, 180, 360, and 720.</em><br><br><em>Day 0 represents the partial calendar day in which the first purchase occurred.</em> <em>Day 1 and onward represent full calendar days afterwards.</em></td></tr><tr><td><strong>Cohort Months</strong></td><td>Dimension</td><td>A month range filter that can select the window of time in which a customer made their first purchase.</td></tr><tr><td><strong>Cohort Interval</strong></td><td>Dimension</td><td><em>Defaulted to Month.</em> Each option groups first-time customers together into cohorts based on the interval selected.</td></tr><tr><td><strong>Cohort Size</strong></td><td>Metric</td><td>The number of customers acquired within the <strong>Cohort Interval</strong>.</td></tr><tr><td><strong>Cumulative Customer Retention</strong></td><td>Metric</td><td>The number of customers that have made one returning purchase by n-day / <strong>Cohort Size</strong></td></tr><tr><td><strong>Gross LTV</strong></td><td>Metric</td><td>Cumulative Gross Sales / <strong>Cohort Size</strong></td></tr><tr><td><strong>Net Sales LTV</strong></td><td>Metric</td><td><p>Cumulative Net Sales / <strong>Cohort Size</strong><br></p><p><em>Net Sales = Gross Sales - Discounts - Returns</em></p></td></tr><tr><td><strong>Net Revenue LTV</strong></td><td>Metric</td><td><p>Cumulative Net Revenue / <strong>Cohort Size</strong><br></p><p><em>Net Revenue = Net Sales + Shipping + Taxes</em></p></td></tr><tr><td><strong>Contribution Profit LTV</strong></td><td>Metric</td><td>Cumulative Contribution Profit / <strong>Cohort Size</strong></td></tr><tr><td><strong>Blended CAC</strong></td><td>Metric</td><td>Direct Ad Spend / <strong>Cohort Size</strong></td></tr><tr><td><strong>Fully Loaded CAC</strong></td><td>Metric</td><td>Total Marketing Spend / <strong>Cohort Size</strong></td></tr><tr><td><strong>Contribution Profit LTV Less Blended CAC</strong></td><td>Metric</td><td><strong>Contribution Profit LTV</strong> - <strong>Blended CAC</strong></td></tr><tr><td><strong>Contribution Profit LTV Less Fully Loaded CAC</strong></td><td>Metric</td><td><strong>Contribution Profit LTV</strong> - <strong>Fully Loaded CAC</strong></td></tr></tbody></table>


# Segment Crossover

A view into customer transitions over time from one segment to another.

*This report should be used to answer the common questions of what percent of customers start with this segment (e.g. "One time purchase") and eventually buy this other segment (e.g. "Subscription") and how well you are doing this over time.*

## Definitions

<table><thead><tr><th>Name</th><th width="124">Type</th><th>Definition</th></tr></thead><tbody><tr><td><strong>Intervals Since First Purchase</strong></td><td>Dimension</td><td>Calculated as the number calendar intervals (e.g. months) from the date of the first purchase, this dimension defines each series on the chart and each column within the table of this report. </td></tr><tr><td><strong>Cohort Months</strong></td><td>Dimension</td><td>A month range filter that can select the window of time in which a customer made their first purchase.</td></tr><tr><td><strong>Cohort Interval</strong></td><td>Dimension</td><td><em>Defaulted to Month.</em> Each option groups first-time customers together into cohorts based on the interval selected.</td></tr><tr><td><strong>Purchase Path</strong></td><td>Dimension</td><td><p>First Segment -> Returning Segment<br><br>This does not mean that the customer bought the Returning Segment right after the First Segment, but eventually did. It is instead a display of the fact that the customer started with the First Segment and eventually bought the different Returning Segment.</p><p><br><em>For instance, a customer buys a NonSubscription as their first and second purchase. This becomes their <strong>First Segment</strong>.  On their third purchase, they buy a Subscription, which is represented here as their <strong>Returning Segment</strong>. As a result, the <strong>Purchase Path</strong> is "NonSubscription -> Subscription".</em></p></td></tr><tr><td><strong>Cohort Size</strong></td><td>Metric</td><td>The number of customers acquired within the <strong>Cohort Interval</strong>.</td></tr><tr><td><strong>Calculation Method</strong></td><td>Metric</td><td><em>Defaulted to Cumulative.</em> <br><br><strong>Incremental:</strong> The number of customers that have purchased a different segment than the one they started with on the <strong>Intervals Since First Purchase / Cohort Size</strong><br><br><strong>Cumulative:</strong> Simply a cumulative version of <strong>Incremental</strong></td></tr></tbody></table>


# Order Retention

This report is derived from transactional sales data and is meant to be used as a reference with the SmartModel. The monthly retention curves in this report are the same actuals used within the model.

*This report differentiates from the* [*Customer Retention*](/using-the-web-app/reports/cohort-analysis/customer-retention) *report by calculating a ratio of orders within an interval since first purchase (e.g. Month 1) divided by the number of orders that were made within the first interval since first purchase (e.g. Month 0). In contrast, Customer Retention does not display the impact of multiple orders, but instead shows the proportion of the originally acquired customers that are making returning purchases over time.*

## Definitions <a href="#definitions" id="definitions"></a>

*Since Day 0, Week 0 and Month 0 will always be 100%, they have been excluded from this report to allow the focus to be on the following periods.*

<table><thead><tr><th width="183">Metric/Dimension</th><th>Definition</th></tr></thead><tbody><tr><td><strong>Order Retention</strong></td><td>Cohorted by when they made their first purchase (<em>Cohort Interval</em>), the number of returning orders divided by the number of orders from the cohort (<em>Cohort Size</em>) in the first interval (e.g. Month 0). For example, Month 1 retention reflects the number of orders in Month 1 from customers acquired in the same <em>Cohort Interval</em> divided by the number of orders that the same cohort made in Month 0.</td></tr><tr><td><strong>Cohort Interval</strong></td><td>This is a control available in the <em>Filters</em> menu with the possible options of <em>Quarter, Month</em>, <em>Week</em>, and <em>Day</em>. Each option groups first-time customers together into cohorts based on the interval selected. For instance, a customer that makes their first purchase on January 15th, 2024 is cohorted into Q1 2024 (<em>quarter</em>), Jan-24 (<em>month</em>), (<em>week of</em>) Jan 14, 2024, and Jan 15, 2024 (<em>day</em>).</td></tr><tr><td><strong>Interval Since First Purchase</strong></td><td>This is a control available in the <em>Filters</em> menu with the possible options of <em>Month</em>, <em>Week</em>, and <em>Day</em>. Each option calculates the calendar distance since the first purchase. </td></tr><tr><td><strong>Segment</strong></td><td>Unlike the Customer Retention report where customers are completely segmented by the first segment (e.g. Subscription) they purchase, this defines the segment that was actually purchased on both the numerator and the denominator of the Order Retention formula. </td></tr></tbody></table>

*For example, let's assume we're looking at Subscription as a Segment and the cohort of Jan. 2020. There were 10,000 orders of the Subscription in Jan. 2020 by customers acquired in the same month. In Feb. 2020 (Month 1), customers acquired in Jan. 2020 made 3,000 orders of the Subscription Segment. The order retention reflected is 3,000 / 10,000 = 30%.*&#x20;

*Order retention is simply a ratio and does not require that the 3,000 orders came from the same customers that made the 10,000 orders. In fact, it's possible some of those customers went on to purchase NonSubscription in Feb. 2020, but that would not be reflected in the order retention because we're purely looking at the Order Retention of the Subscription Segment.*


# Retention by Nth Order

This report is derived from your Sales data (e.g. DTC Sales from Shopify or Amazon Sales from Amazon).

*Unlike the Customer Retention report, this report calculates retention by each subsequent order the customer has made.*&#x20;

## Definitions <a href="#definitions" id="definitions"></a>

<table><thead><tr><th width="183">Metric/Dimension</th><th>Definition</th></tr></thead><tbody><tr><td><strong>Nth Order Retention</strong></td><td><p>The number of customers that made an nth (e.g. 7th) order divided by the number of customers in the cohort. </p><p></p><p>Unlike Customer Retention, where the retention is measured is measured over time and customers can skip intervals since first purchase, customers at one order number had to have also been in all prior order numbers. For instance, a customer that has made a 4th order will show up as being retained within the 2nd and 3rd order as well.</p></td></tr><tr><td><strong>Cohort Interval</strong></td><td>This is a control available in the <em>Filters</em> menu with the possible options of <em>Quarter, Month</em>, <em>Week</em>, and <em>Day</em>. Each option groups first-time customers together into cohorts based on the interval selected. For instance, a customer that makes their first purchase on January 15th, 2024 is cohorted into Q1 2024 (<em>quarter</em>), Jan-24 (<em>month</em>), (<em>week of</em>) Jan 14, 2024, and Jan 15, 2024 (<em>day</em>).</td></tr><tr><td><strong>Max Days Since First Purchase</strong></td><td><strong>Important filter to use.</strong> Since a returning order can occur at any time, this filter controls for the length of time that each <strong>Cohort Interval</strong> has had to make <em>x</em> number of orders.</td></tr><tr><td><strong>First Segment</strong></td><td>The first segment (e.g. Subscription) that the customer purchased.</td></tr></tbody></table>


# Sales Reports

Drivepoint currently offers Sales reports for DTC, Amazon and Wholesale channels.

<details>

<summary>What does the <strong>Customer Type</strong> field mean?</summary>

Here is how we define customer types:

* By Purchase Order:
  * Order split based on their first purchase and all purchases that occur afterwards. A customer can only have one First-Time purchase. **This is the same way that Shopify categorizes First-Time and Returning.**
  * Customer Types:
    * First-Time: the first purchase a customer ever makes at your brand.
    * Returning: any purchase after the first purchase.
* By Segment Purchase Order:
  * Order split based on the first time they purchase a segment and all purchases of the same segment afterwards. A customer can make more than one First-Time purchase in this method, but only one per Segment. **Commonly used to see how many orders are from the first purchase of a subscription.**
  * Customer Types:
    * First-Time: the first purchase a customer makes of a Segment.
    * Returning: any purchase after the first purchase of the Segment.
* By SmartModel Basis:
  * Order split that lines up with the way the SmartModel breaks purchases into two categories.
  * Customer Types:
    * Month 0: any purchase that occurs within the month the customer was acquired, which is the same month they made their first purchase.
    * Month 1+: any purchase that occurs in a month that follows the customer’s acquisition month.

</details>

<details>

<summary>What does the Product Customer Type field mean?</summary>

**Product Customer Type**: Based on the Product Dimension selected (e.g. SKU), we determine if the customer has purchased the same Product before.

* *First-Time* means the customer has never purchased this product before - even if they are a Returning Customer Type.
* *Returning* means the customer has purchased this product before. You cannot have a *Returning* *Product Customer Type* combined with a *First-Time Customer Type* because it is the first purchase ever by the customer.\
  \
  *(Identical products purchased within the same order are considered ties and do not matter to this calculation.)*

</details>

<details>

<summary>What are the Amazon fees?</summary>

Check out our overview on Amazon fees [here](/using-the-web-app/reports/amazon-reports).&#x20;

</details>

<details>

<summary>What are the Tik Tok Fees?</summary>

* **Commission Fee**: An amount charged for each successful order, based on rates that differ for each product sub-category.&#x20;
* **Transaction Fee:** An amount charged for processing successful orders.
* **Affiliate Commission:** When an Affiliate has helped seller sell a product, and the order has not been cancelled or successfully refunded before the settlement period ends, TikTok Shop will automatically deduct an amount from the order.

Learn more about [Seller Fees](https://seller-my.tiktok.com/university/essay?knowledge_id=2602429108078338\&default_language=en\&identity=1) and browse through [Tik Tok Shop's FAQ](https://seller-my.tiktok.com/university/essay?knowledge_id=5183284380763905\&default_language=en\&identity=1).&#x20;

</details>

<details>

<summary>I have multiple Shopify Stores. How can I filter across my stores?</summary>

Simple open the "Customize" panel by pressing the button on the top right and selecting the store that you would like to see under the "Store" Filter on the bottom.&#x20;

</details>

<details>

<summary>What are all available dimensions in the multi-filter?</summary>

* The options available in each dimension are based on the time frame. Select a longer timeframe to find an older discount code
* The options in each dimension are also listed based on frequency.

## **Use Cases**

1. I want to see Sales minus the one discount code that I used for an experiment
2. I would like to see Sales coming from youtube.com
3. I would like to see Sales from the Northeast or just NYC

***Exclude any…***

* *Discount Code*
* *Channel Name*
* *Country/Region/City*
* *Tags*
* *Payment Provider*
* *Landing Site*
* *Referring Site*

***Select greater/less than for…***

* *Units Sold (select greater/less than)*
* *Purchase Order*

</details>

<details>

<summary>How do I view Total Sales or just by Sub vs. Non-Sub?</summary>

Use the Chart Dimension field! Here's a Loom on how to do that: <https://www.loom.com/share/2a6729c1800647e1a24b75148fa64cd9>

</details>


# Monthly Review

Find all of the key reports necessary for board meetings, investor updates or all-hands team meetings in this review.


# Cash Conversion Cycle

Answers how long it takes your company to convert investments in inventory into cash flows from Sales.

## Formula

The cash conversion cycle (CCC) is a metric that measures the number of days a company takes to convert the stock and inventory investments they’ve made into revenue from sales. The point is to measure the time between your investment (in inventory) and your return on that investment (through sales). This measurement can give you a sense of the health of your business and help you measure risk.

If the cash conversion cycle is shortening, this is a good sign as your business is leaving less and less cash tied up somewhere as you grow. It is a negative sign if the cash conversion cycle of your company is increasing or getting slower because it means more of your cash is being tied up for longer.

#### CCC = Days Inventory Outstanding (DIO) + Days Sales Outstanding (DSO) - Days Payable Outstanding (DPO) <a href="#ccc--days-inventory-outstanding-dio--days-sales-outstanding-dso---days-payable-outstanding-dpo" id="ccc--days-inventory-outstanding-dio--days-sales-outstanding-dso---days-payable-outstanding-dpo"></a>

DIO = (Total Inventory: Finished Goods / Cost of Goods Sold) \* Number of Days

DSO = (Accounts Receivable / Net Revenue) \* Number of Days

DPO = (Accounts Payable / Cost of Goods Sold) \* Number of Days


# Performance vs. Plan

This report provides an insight into how your company is pacing to plans across different metrics for the current month.

💡 Schedule your Performance vs. Plan report to get daily updates on how you're pacing. You can add as many team members as you'd like.

💡 Use the Cross-Channel PvP report if you have AMZ AND Shopify connected. Use only the DTC PvP if you only have Shopify connected.

## Quick Links

{% content-ref url="/pages/w3wOEpOr52GlkN48IISk" %}
[Performance vs. Plan](/using-the-web-app/reports/performance-vs.-plan/performance-vs.-plan)
{% endcontent-ref %}

{% content-ref url="/pages/zIU1kKP9u4JsdbPjMmtq" %}
[DTC Performance vs. Plan](/using-the-web-app/reports/performance-vs.-plan/dtc-performance-vs.-plan)
{% endcontent-ref %}


# Performance vs. Plan

Track in-month performance on a P\&L basis across all your channels.

## Setup

1. If you just want to see Shopify (DTC) or Amazon (Marketplace) performance vs. plan, use the filter on the bottom right to remove the other channels
2. If you want to understand how you're pacing all the way down the P\&L and understand which channels are driving the differences, unselect the channel filter.&#x20;

<figure><img src="https://80593965-files.gitbook.io/~/files/v0/b/gitbook-x-prod.appspot.com/o/spaces%2FePRvSjErXFousUDSWAz7%2Fuploads%2FYyn4tpCsqJFcETn4GJAy%2Fcross-channel%20PvP%20with%20AMZ%20Jimo%20flow.png?alt=media&amp;token=336c3e7f-cef6-4f4b-9390-773fd462c941" alt="" width="188"><figcaption></figcaption></figure>

## How does it work?

1. We break down your DTC and Marketplace sales (like Amazon) to a daily level
2. We bring in your monthly plan and apply ratios like margin % to your actual daily revenue
3. Metrics like Operating Expenses, which aren’t tied to a channel, use the plan number directly
4. Any metric marked with a `*` means it's based on an assumption or estimate
5. We then forecast the rest of the month based on this logic
6. Finally, we calculate totals — like Operating Income — depending on whether you’re using channel-level actuals

## Detailed Explanation

This report is built through a complex, multi-step process.

1. We load in transactional data representing DTC and Marketplace (e.g. Amazon) and aggregate it to a daily level.
2. We load in every plan's monthly forecasted financial metrics for the current month and calculate ratios against the net revenue. These ratios are then applied directly to the actual net revenue that's tracked for the day. For instance, we calculate a contribution margin percentage assumed in the plan; this creates a dynamic contribution profit across each day of the month.
   1. The exception to this rule is non-channel metrics like Operating Expenses where we directly use the plan's value.
   2. Note: Every metric that is labeled with a **\*** is a metric that does not come directly from transactional actuals. These metrics required making an assumption, either to plan or using the ratio calculation mentioned above.
3. We forecast to the end of the month for every metric using the methodology described below in the **How do you calculate the EOM Projections Value?** FAQ below.
4. Finally, we sum up to a non-channel total for all of the channel-specific metrics, such as "Orders", and calculate the downstream metrics like "Operating Expenses" and "Operating Income" that are not channel-specific. This summation step is dependent on the selection of the **Use Channel Actuals**, which is described in the FAQ below.

## FAQ

<details>

<summary>How do you calculate the EOM Projections Values?</summary>

The entire projection functionality is based on your historical in-month cumulative growth trend for each one of these metrics. In other words, **the report uses the historical trends to create the plan projection** instead of a linear projection (month plan value / # of days).<br>

For the high and low projection values, the prediction interval is based on a 95% confidence margin of error around the average, which is based on the standard deviation seen across time for how a month will grow (*e.g. Day 10 is 25% of total month in one month, but it's 30% of total month in another month*). The earlier in the month we are the larger this prediction interval will be given the small sample relative to the month's number of days.

</details>

<details>

<summary>What does the field "Use Channel Actuals" mean?</summary>

This field defaults to all of the transactional channels we currently fully support. If you remove one of them, the report will recalculate with the assumption that the channel you removed is now held to the plan value, meaning any deviation from plan is caused by the channel that you are still selecting in the field. For instance, if you only have "DTC Online" selected, all other channels are going to be assumed at the exact forecasted plan value.

</details>

<details>

<summary>What does "Cumulative Chart View" Mean?</summary>

The cumulative chart view shows your summed Sales performance (Day 1 + Day 2 + Day 3 + ... + ). This is a helpful view to analyze how you are pacing to your end of month plan forecast.\
The non-cumulative chart view does not sum up the daily values. Instead it shows each day as a stand-alone value (Day 1, Day 2, Day 3, ..., etc).

</details>

<details>

<summary>Why are metrics beyond "Operational Expenses" not categorized by channel?</summary>

This is because our standard SmartModel template does not break out these metrics by channel.

</details>

<details>

<summary>I currently only have AMZ connected - will the PvP still work for me?</summary>

Currently, this report works for companies that at least have a DTC channel that's updating on a daily basis.

</details>


# DTC Performance vs. Plan

The "actuals" data is pulled from your eCommerce data source (e.g. Shopify).

## Definitions

* EOM: End of Month
* MTD: Month to Date
* Projected vs. Plan: Projected metric value based on current pacing vs. Plan metric value (see more below)

### What does the Cumulative Chart View mean?

The cumulative chart view shows your summed Sales performance (Day 1 + Day 2 + Day 3 + ... + ). This is a helpful view to analyze how you are pacing to your end of month plan forecast.\
The non-cumulative chart view does not sum up the daily values. Instead it shows each day as a stand-alone value (Day 1, Day 2, Day 3, ..., etc).

### How do you calculate the EOM Projections Values?

The entire projection functionality is based on your historical in-month cumulative growth trend for each one of these metrics. In other words, **the report uses the historical trends to create the plan projection** instead of a linear projection (month plan value / # of days).<br>

For the high and low projection values, the prediction interval is based on a 95% confidence margin of error around the average, which is based on the standard deviation seen across time for how a month will grow (*e.g. Day 10 is 25% of total month in one month, but it's 30% of total month in another month*). The earlier in the month we are the larger this prediction interval will be given the small sample relative to the month's number of days.

## FAQ

<details>

<summary>How do I use this report?</summary>

1. Select a plan you would like to view to compare to actuals
2. Select a chart view (cumulative vs. non-cumulative) *💡See below*
3. Select a metric to view

</details>

<details>

<summary>How can I view Sales performance across different months?</summary>

The performance vs. plan report only shows the view for a current month. If you want to evaluate Sales performance in the past months, navigate to the DTC or Amazon Sales reports. \
**💡 Type in "DTC Sales" or "Amazon Sales" in the search box on the main reports page.**

</details>

<details>

<summary>How can I view my Sales pacing for multiple plans at once?</summary>

Currently, you are only able to compare against one plan. However, feel free to open the report in multiple windows (copy & paste the URL) and get a side by side view between different plans.&#x20;

</details>

<details>

<summary>Is there another way to get regular Sales pacing updates?</summary>

Yes! Instead of always clicking on the performance vs. plan report, feel free to click the ⏰ icon on the top right of the report to schedule an email send to you and your colleagues. Feel free to send it daily to always be up to date with your Sales performance - right in your inbox.

</details>


# Amazon Reports

Find below important information on the Amazon data feeding into Drivepoint.

## Explanation of Amazon Seller Fees

**Commission Fees** *(otherwise known as referral fee)*: variable sales fees for the privilege of selling on Amazon.

**Amazon Fulfillment Fees:** variable fees to pay Amazon for fulfilling the product storage and shipment.

**Other Fees:** Everything else that is not grouped within Amazon's Comissions and Fulfillment Fees.&#x20;

{% hint style="info" %}
Check out [this](https://www.webfx.com/blog/marketing/amazon-seller-fees/) list of an overview of all fees *(although we have not seen the relevance of breaking it out across our customer analysis).* If you do want certain fees to be broken out individually, please submit a request by emailing <support@drivepoint.io>
{% endhint %}

*\***Shipping fees** are netted out in Shipping Income*

**Do you have more questions?** *We're here for you!*

{% content-ref url="/spaces/GWP01Uan8w7wePRkCAQS/pages/JIL9p5hP3IZ9pTXZcuqP" %}
[Contact Us](/help-1)
{% endcontent-ref %}


# Wholesale + Retail Reports

Compare core metrics like POS Sales and Velocity across accounts and products.

*The data of the wholesale reports is provided by* [*Muffin Data*](https://www.muffindata.com/)*™*

### **Basic Definitions**

**Product**: We think of the standard product as the entity, which has among other things, a name, a UPC, and a [SKU](https://en.wikipedia.org/wiki/Stock_keeping_unit). The same product might have multiple SKUs across the different retailers, so there are edge cases. Shopify as you know has products with variants, and the variants have SKUs — and multiple products might share the same SKU.&#x20;

**Account**: Refers to the Parent Reporting Account which often directly equates to the name of the retailer (e.g. Albertson, HEB, etc)

**Distribution Center**: *(most likely UnFi or Kehe)* The location from which you can approximate velocity based on the shipped and ordered units from an account if you do not have direct POS Scan data.

### Key Metrics

<table><thead><tr><th width="154">Term</th><th>Description</th><th>Examples</th></tr></thead><tbody><tr><td><strong>Stores Selling</strong></td><td>Individual number of ACTIVE stores you are selling at</td><td><em>Also known as POS (Points of Sales) or doors</em></td></tr><tr><td><strong>POD</strong></td><td>Points of Distribution: POS * SKUs</td><td><em>Highlights how many distribution points you have as a company within a store</em></td></tr><tr><td><strong>POS Sales Dollars</strong></td><td>Revenue of retailer</td><td><em>The revenue Whole Foods Store on 24th St. makes from selling one Protein Bar 12-pack chocolate</em></td></tr><tr><td><strong>POS Scan Velocity</strong> <em>(Units Sold Per SKU per Store per Week)</em></td><td>The # of products sold per individual store per week</td><td><em>“Our velocity for WholeFoods 24th St for Protein Bar 12-pack chocolate was 10 last week”</em></td></tr><tr><td><strong>Distribution Center Velocity</strong></td><td>The # of products or cases shipped by individual Distribution center per week/month</td><td><em>"Our KeHe Portland location has a ship_to velocity to Albertson of 1000 cases a week"</em></td></tr><tr><td><strong>Units Sold Per Product</strong></td><td># of units sold per product</td><td><em>Protein Bar 12-pack chocolate sold 100 times yesterday</em></td></tr><tr><td><strong>Units Sold</strong></td><td># of units sold<br>Can be either POS based OR distributors shipped (units sold is calculated differently per store)</td><td><em>We sold 2000 units across all SKUs yesterday</em></td></tr><tr><td><strong>POS Revenue per Product per Store Selling per Week</strong></td><td>Retailer revenue per Product per store per week</td><td><em>As Whole Foods 24th St, I made $1000 in Protein Bar 12-pack chocolate Sales last week</em></td></tr></tbody></table>

**We are happy to help in case you have any questions. Feel free to contact us anytime.**&#x20;

{% content-ref url="/spaces/GWP01Uan8w7wePRkCAQS/pages/JIL9p5hP3IZ9pTXZcuqP" %}
[Contact Us](/help-1)
{% endcontent-ref %}


# Alloy Retailer Metrics

## Alloy Retailer Metrics Report

### Overview

The **Alloy Retailer Metrics Report** is available under the **Wholesale & Retail bundle**, located alongside the three Muffin reports. This report provides dynamic retail metrics powered by the Alloy integration.

> **Note:** The three Muffin reports within this bundle require the **Muffin data integration** to populate data. However, the Alloy integration can also be connected separately to populate this specific report.

***

### Getting Started

#### Prerequisites

You must have one of the following integrations enabled:

* **Alloy** *(contact our CS team to get integrated)*

***

### Dashboard Layout

The Alloy Retail Metrics report uses a unique UI compared to other DrivePoint reports. Filters are displayed here **at the top of the dashboard** across multiple rows.

> **Tip:** Click the filter area to expand/collapse the filter rows if they are hidden.

#### Filters

| Filter           | Description                                                                  |
| ---------------- | ---------------------------------------------------------------------------- |
| **Date**         | Select the date range for your report.                                       |
| **Interval**     | Toggle between `Month` or `Week (Sun-Sat)`.                                  |
| **Metric Value** | Choose which metric to display (e.g., Unit Sales).                           |
| **Dimension**    | A control that switches the breakdown dimension used in the chart and table. |

#### Dimension Control

The **Dimension** control allows you to change how data is grouped. There are five available dimensions:

1. **Partner** *(default)* — Groups data by retail partner.
2. **Product Name** — Groups data by product name.
3. **SKU** — Groups data by SKU.
4. **EPC** — Groups data by EPC.
5. **Item Number** — Groups data by item number.

When you switch dimensions, the chart series and the table output below it will update automatically to reflect the selected grouping. These dimensions are also available as individual filters.

***

### Working with Metrics

#### Selecting a Metric

The **Metric Value** filter lets you choose from a variety of metrics provided by Alloy. The default metric is **Unit Sales**.

> **Important:** Not every metric is available for every retailer. Unit Sales is generally available across all retailers, but other metrics may vary. You will need to test availability for your specific retail partners.

#### How Metrics Are Calculated

All metrics are **pre-calculated** within Drivepoint's data pipelines and pre-aggregated based on the selected interval and dimension breakdowns.

When you select a metric, a description is displayed on the dashboard showing:

* How the metric is **calculated by Alloy**
* How it has been **aggregated within DrivePoint**

#### Aggregation Types

| Aggregation Type | Description                                           | Example Metrics                  |
| ---------------- | ----------------------------------------------------- | -------------------------------- |
| **Sum**          | Values are summed across the selected interval.       | Unit Sales, Receipts             |
| **Last Value**   | The final value within the selected interval is used. | Ending Inventory, Ending On-Hand |

> **Example:** If you select "Ending Inventory On Order" with a **monthly** interval, the report will display the last recorded value for that metric within each month. If you switch to a **weekly** interval, it will show the last value for each week instead.

***

### FAQ

**Q: Why is this metric selection showing none or sparse data for this partner?**

A: Not all metrics are available for every retailer and some are infrequently tracked by the retailer. Try switching to a different metric such as Unit Sales, which has the broadest availability.

**Q: What's the difference between the Alloy integration and the Muffin integration?**

A: The Muffin integration is required for the other three reports in the Wholesale and Retail bundle. The Alloy integration can be connected independently and will populate the Alloy Retailer Metrics report specifically.

**Q: How frequently is the data updated?**

A: Data is pulled by Alloy from the retailers, which is receives updated data from the retailers on a varying basis - it is generally updated on a weekly basis. Drivepoint cleans up the data further and pre-aggregates it further. We run this process on a daily basis.


# Scheduling Reports

You are able to schedule email sends of any report to you or anyone else in your team on a regular basis.

#### How do I schedule my first report?

1. Navigate to the individual report you would like to schedule an email send for
2. Click on the clock (⏰) icon on the top right
3. Click on "New Schedule"
4. Enter a name (existing Drivepoint user) or an email address (non-existent Drivepoint user) to whom you would schedule the email send to.

   *💡You can enter as many as you want*
5. Determine the frequency of the email (Daily/weekly/monthly)
6. Select the day(s) of when you would like to receive the scheduled report
7. Determine the time of when you would like to receive the scheduled report
8. Select the file type (CSV/pdf)
9. Click "Schedule report"
10. Congrats - you scheduled your first report🎉

#### What are some good examples of email schedules I should set?

* Weekly LTV by First-Order Segment *(via "LTV by Dimension" in the Cohort Analysis Bundle)*
* Monthly Operating Income *(via "Profit and Loss Statement" in the Finance Core Bundle)*
* Daily Sales by SKU *(via "Sales by Product" in the DTC Sales bundle)*

#### How do I view all of my report schedules?

1. Navigate to any individual report
2. Click on the clock (⏰) icon on the top right
3. Click on "Other Reports"
4. View, edit or delete all of your existing report schedules

{% hint style="info" %}
Sometimes there might be fresher raw data that is not stored in the data warehouse yet which might delay reports that you set to schedule on a daily basis. To see the most recent raw data available in your Data Warehouse, navigate to the Data Source screen on the left sidebar.
{% endhint %}


# Benchmarks

Compare your performance to other Drivepoint customers in your monthly net revenue category.

<figure><img src="https://80593965-files.gitbook.io/~/files/v0/b/gitbook-x-prod.appspot.com/o/spaces%2FePRvSjErXFousUDSWAz7%2Fuploads%2FUX2lsoyKYXCUuRlNVcab%2FP%26L%20Benchmarks%20FF.png?alt=media&amp;token=c12cc76e-928d-4bc6-8201-cfeaf07ed35e" alt=""><figcaption><p>P&#x26;L Benchmarks Report</p></figcaption></figure>

## How to best use the P\&L Benchmark Report

1. Select your time period on the top right
2. Filter based on the monthly revenue of the benchmark set (default: the segment you are in)
3. Hover over the table to view your values by metric compared to others
4. Open the sub-menu of the "channel categorized" metrics, e.g. Net Revenue Margin and Shipping Income to compare "DTC" vs. "Marketplace" performance


# LTV Benchmarks

Identify how your per-customer profitability and retention metrics stack up to other companies.

#### How it works:

For every Drivepoint customer, we create an aggregation per cohort month of an assortment of per-customer metrics, such as Gross LTV. We then place these aggregations together as a dataset to use in  the report. When you modify the cohort months date range or any of the filters on the right side, we re-calculate quartiles for every single metric.&#x20;

**How to interpret:**

In the chart, you'll get a view of a single metric compared to the three quartiles (25th percentile, Median, and 75th percentile). If your company is sitting between the 25th and 75th percentiles, that means you're in the middle 50% of Drivepoint customers. The best use of this chart is to show how you are trending over time against similar companies, which could be handy to show off to investors if you're outperforming the "market".&#x20;

*Note: You may notice that picking certain Day N metrics to show in the chart causes the date range to shorten more than the date range you had picked. This is because in order to display those values those cohort months needed to have enough time to reach that Day N. For instance, picking a Day 60 metric means that the prior cohort month is never going to show up because Day 60 essentially means a cohort month will need to have about two full months to elapse.*

In the table, we output every single metric that we aggregated as described above. This does not give you an over-time basis to study the metric, but it gives you a summary level interpretation, relative to the date range and other filters, of how your company compares to the rest. In this table, being above the Median will give you an *Above Benchmark* or *Strength* rating. The exception are the CAC metrics where we generally consider having a lower CAC to be more valuable.

*-------------------------------------------------------------------------------------------------------------------*

Let's walk through an example. We're curious about how our Net Sales LTV stacks up to the rest of Drivepoint customers in our Product Category. Looking at the table (see below), we can see our company's metric is in the 2nd Quartile and it says (41.7/100). The 41.7 means that our Net Sales LTV is better than 41.7% of Drivepoint customers, but it also means that the metric is worse than 58.3% of Drivepoint customers (100 - 58.3).

<figure><img src="https://80593965-files.gitbook.io/~/files/v0/b/gitbook-x-prod.appspot.com/o/spaces%2FePRvSjErXFousUDSWAz7%2Fuploads%2FIvKHx5wPz4D6hkYuDWUo%2Fimage.png?alt=media&amp;token=2747ab4c-4f37-4b38-a4b4-2e1faf480091" alt=""><figcaption><p>Quartile Ranking</p></figcaption></figure>

So then the question becomes "what is a Net Sales LTV value that would get our company into the top of Drivepoint customers?" We can then hover over the quartile bar in the table for Net Sales LTV and see five different values: **25th Percentile**, **75th Percentile**, **Benchmark Median**, **our company name**, and **Difference**. The first three are Net Sales LTV values at three key percentile marks. For instance, the Benchmark Median (or 50th Percentile) is what the Net Sales LTV is for a company that better than 50% of Drivepoint customers and also worse than 50% of Drivepoint customers - it's right in the middle. The company name shows us what our LTV value is calculated as, and the Difference shows us what the difference is between our company's metric and the Benchmark Median; so how much more or less the metric would have to be to become the median (see example below).

<figure><img src="https://80593965-files.gitbook.io/~/files/v0/b/gitbook-x-prod.appspot.com/o/spaces%2FePRvSjErXFousUDSWAz7%2Fuploads%2FnjgDzyRZvcTirA4BSqbB%2Fimage.png?alt=media&amp;token=6bd7f233-7b30-4a01-bdeb-619f8d4fe559" alt=""><figcaption><p>Example of the hover menu in the table</p></figcaption></figure>

**Metrics**

Every metric except for the CAC metrics has six different versions - one without any mention of a "Day N", which means the metric shows an all-time basis, and five with different Day Ns, which reflect the *n days* *after the customer's first purchase*. We generally advise using the Day N metrics in the chart to standardize the amount of time that has elapsed for the cohort.

| Metric                                   | Definition                                                                                                                                                                                                                                                                                                                                                                                                                                                                                                                                                                                                               |
| ---------------------------------------- | ------------------------------------------------------------------------------------------------------------------------------------------------------------------------------------------------------------------------------------------------------------------------------------------------------------------------------------------------------------------------------------------------------------------------------------------------------------------------------------------------------------------------------------------------------------------------------------------------------------------------ |
| Gross Sales LTV                          | The average amount of cumulative gross sales a customer has made.                                                                                                                                                                                                                                                                                                                                                                                                                                                                                                                                                        |
| Net Sales LTV                            | <p>The average amount of cumulative net sales a customer has made.</p><p></p><p><code>Net Sales = Gross Sales - Discounts - Returns</code></p>                                                                                                                                                                                                                                                                                                                                                                                                                                                                           |
| Contribution Profit LTV                  | <p>The average amount of cumulative contribution profit a customer has contributed. This metric blends the financial model with the transactional data we pull from the APIs. We use the contribution profit margin that's tracked for every month within the model and apply it to all purchases within the same month. (If we don't have the contribution profit margin yet due to unclosed financials, we pull a three month average forward from the financials that are closed.)</p><p></p><p><code>Contribution Profit = Contribution Profit Margin \* Net Revenue (not used as a metric in this report</code></p> |
| Blended CAC                              | `Direct Ad Spend per customer`                                                                                                                                                                                                                                                                                                                                                                                                                                                                                                                                                                                           |
| Fully Loaded CAC                         | `Total Marketing Spend per customer`                                                                                                                                                                                                                                                                                                                                                                                                                                                                                                                                                                                     |
| Contribution Profit LTV Less Blended CAC | <p>The average cumulative profit a customer contributes to the company after <em><strong>direct</strong></em> marketing expenses are removed. Blended CAC is pulled from the financial model from closed actuals. (If we don't have the closed numbers for CAC for an unclosed month, we pull forward a three month average of actuals to use until that month is closed.)</p><p></p><p><code>Contribution Profit LTV Less Blended CAC = Contribution Profit LTV - Blended CAC</code></p>                                                                                                                                |
| Contribution Profit LTV Less Blended CAC | <p>The average cumulative profit a customer contributes to the company after <em><strong>total</strong></em> marketing expenses are removed. Fully Loaded CAC is pulled from the financial model from closed actuals. (If we don't have the closed numbers for CAC for an unclosed month, we pull forward a three month average of actuals to use until that month is closed.)</p><p></p><p><code>Contribution Profit LTV Less Fully Loaded CAC = Contribution Profit LTV - Fully Loaded CAC</code></p>                                                                                                                  |
| Contribution Profit LTV / Blended CAC    | This provides a metric that some companies look at (LTV/CAC) and, for the purposes of this report, provides a better relative basis to look at profitability by indexing the contribution profit to the CAC spent.                                                                                                                                                                                                                                                                                                                                                                                                       |
| Cumulative Customer Retention            | The percentage of customers that have made at least **one returning purchase**.                                                                                                                                                                                                                                                                                                                                                                                                                                                                                                                                          |


# Inventory Reports

Drivepoint connects with 90+ out of the box WMS and 3PLs. We're able to visualize what's in your warehouse and figure out when you should order.&#x20;

#### Inventory Data Breakdowns <a href="#inventory-breakdowns" id="inventory-breakdowns"></a>

| Field           | Definition                                                       | Formula                                                                                              |
| --------------- | ---------------------------------------------------------------- | ---------------------------------------------------------------------------------------------------- |
| `awaiting`      | Inventory that is expected to arrive to a warehouse.             |                                                                                                      |
| `onhand`        | Total quantity in the warehouse.                                 | committed + unfulfillable + fulfillable (this formula does not apply if an item has substitute SKUs) |
| `committed`     | Inventory that is already assigned to orders.                    |                                                                                                      |
| `unfulfillable` | Inventory that is damaged, quarantined, etc…                     |                                                                                                      |
| `fulfillable`   | Inventory that can be fulfilled and shipped for orders.          |                                                                                                      |
| `unsellable`    | Inventory that is being held from sales channels (e.g. reserved) | `deprecated`                                                                                         |
| `sellable`      | Inventory that is available in sales channels.                   |                                                                                                      |

<br>


---

[Next Page](/llms-full.txt/1)