# How do I know if my data is accurate?

## Quickbooks

1. Reconcile to Quickbooks on the import (calculate net income) and compare to net income
2. Go to Quickbooks and confirm the import
3. Check live on the M-Monthly tab in the SmartModel™ as indicators *(performed on a monthly basis)*

<figure><img src="https://2089194542-files.gitbook.io/~/files/v0/b/gitbook-x-prod.appspot.com/o/spaces%2FuPhWdKX288WBK7UyaQZw%2Fuploads%2FPZkJvIKZvdc38aYiWcOC%2Fimage.png?alt=media&#x26;token=9bb23e19-d458-473b-b026-07435f786208" alt=""><figcaption><p>The green rows indicate that there are no issues and everything matches QBO.</p></figcaption></figure>

4. Data "Freshest Data Available" shows when data was pulled in the warehouse and can be imported in the SmartModel™.&#x20;

<figure><img src="https://2089194542-files.gitbook.io/~/files/v0/b/gitbook-x-prod.appspot.com/o/spaces%2FuPhWdKX288WBK7UyaQZw%2Fuploads%2FH1z1sES16BWo0hcJ9T74%2Fimage.png?alt=media&#x26;token=e192baf5-edba-4237-a152-a31d88e41413" alt=""><figcaption><p>Example: Latest data for QBO that can be imported into the SmartModel is from June 18th, 4am EST</p></figcaption></figure>

## Shopify

1. Navigate to the Shopify [Analytics](https://admin.shopify.com/dashboards) Dashboards
2. Add the desired time frame and metric
3. Compare the Shopify Sales performace to Drivepoint Shopify reports&#x20;

<figure><img src="https://2089194542-files.gitbook.io/~/files/v0/b/gitbook-x-prod.appspot.com/o/spaces%2FuPhWdKX288WBK7UyaQZw%2Fuploads%2FcK3mmrfGRuzIl83f1Mu5%2Fimage.png?alt=media&#x26;token=e3af85cd-a9f2-4398-9b6e-7e833e7d9b7e" alt=""><figcaption><p>
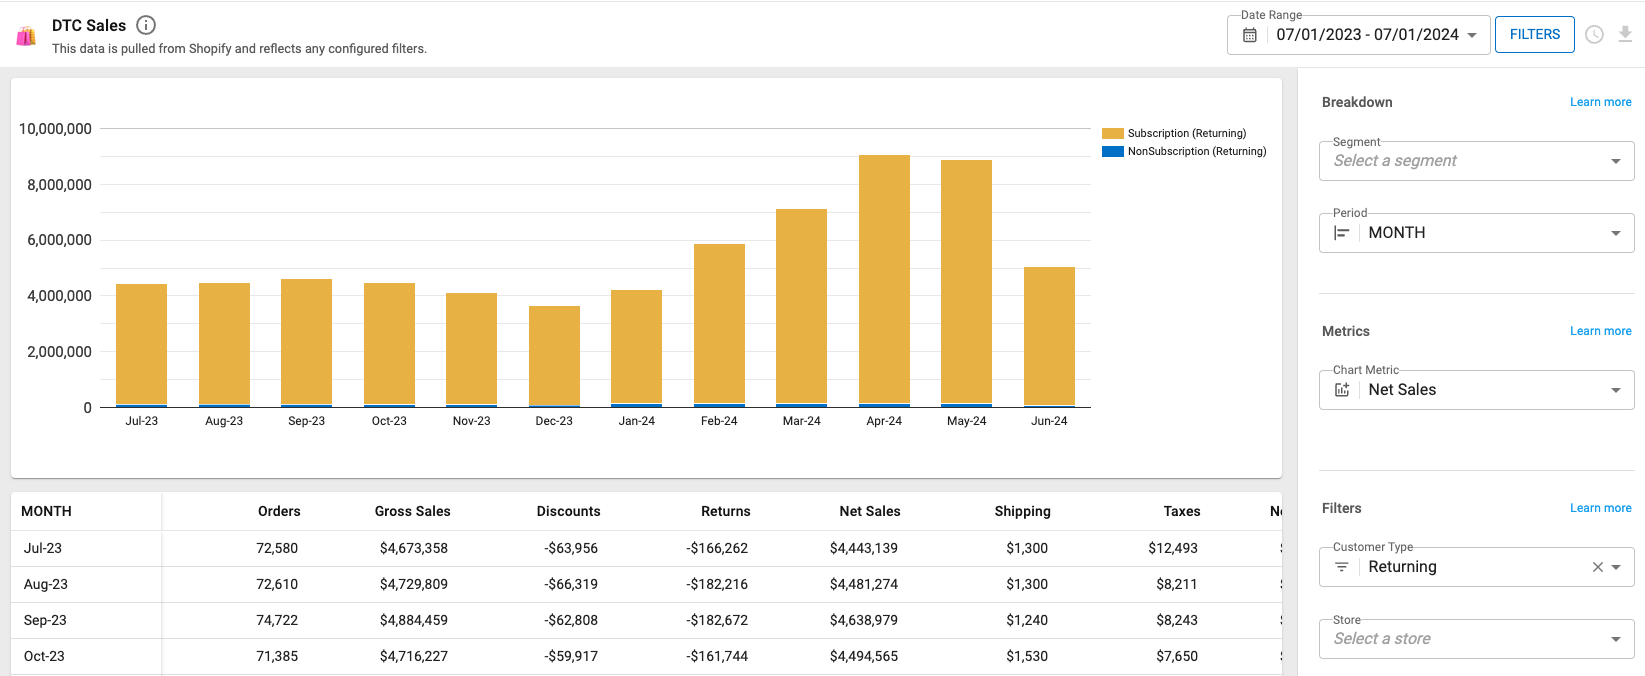
Drivepoint > Reports > DTC Sales</p></figcaption></figure>

## Amazon

1. Navigate to the Amazon Sales Dashboard
2. Add the desired time frame, sales breakdown and fulfillment channel

<figure><img src="https://2089194542-files.gitbook.io/~/files/v0/b/gitbook-x-prod.appspot.com/o/spaces%2FuPhWdKX288WBK7UyaQZw%2Fuploads%2FEk4k5nThzpXakeI6OHYI%2Fimage.png?alt=media&#x26;token=a8d0bb60-26ab-4385-b3e5-a6c27d783d20" alt=""><figcaption><p>
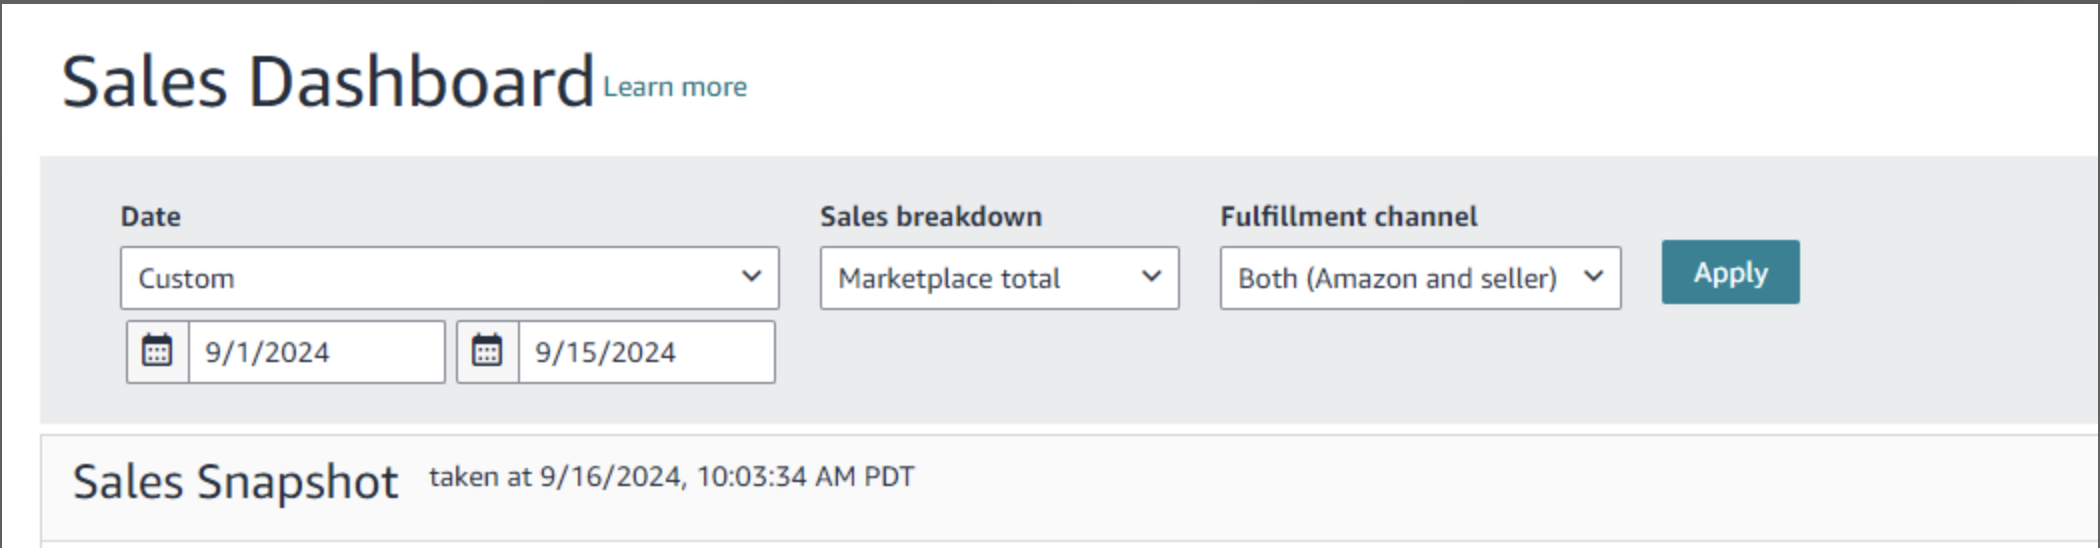
Sales Dashboard within Amazon Seller Central</p></figcaption></figure>

3. Compare the Amazon Sales dashboards to Drivepoint Amazon reports

<figure><img src="https://2089194542-files.gitbook.io/~/files/v0/b/gitbook-x-prod.appspot.com/o/spaces%2FuPhWdKX288WBK7UyaQZw%2Fuploads%2F1YIVZr4O3eokq8FXDDzR%2Fimage.png?alt=media&#x26;token=91707dff-6447-405b-9976-1e0dcbf8e12f" alt=""><figcaption><p>Drivepoint > Reports > Amazon Sales</p></figcaption></figure>

*We are working on a fix to ensure all Amazon data is always up to date, however we encountered that there sometimes might be a 14-Day time lag for Amazon Sales data. Learn more by clicking on Amazon reports below.*

{% content-ref url="<https://app.gitbook.com/s/ePRvSjErXFousUDSWAz7/reports/amazon-reports>" %}
[Amazon Reports](https://app.gitbook.com/s/ePRvSjErXFousUDSWAz7/reports/amazon-reports)
{% endcontent-ref %}

## Muffin Data

1. Navigate to the Muffin Data [Dashboard](https://analytics.muffindata.com/)
2. Select the desired time frame and metric

<figure><img src="https://2089194542-files.gitbook.io/~/files/v0/b/gitbook-x-prod.appspot.com/o/spaces%2FuPhWdKX288WBK7UyaQZw%2Fuploads%2FdO3RRtjqGAF0ZzhvbLIa%2Fimage.png?alt=media&#x26;token=9c281856-1293-4e71-878a-d1472acd2b22" alt=""><figcaption><p>
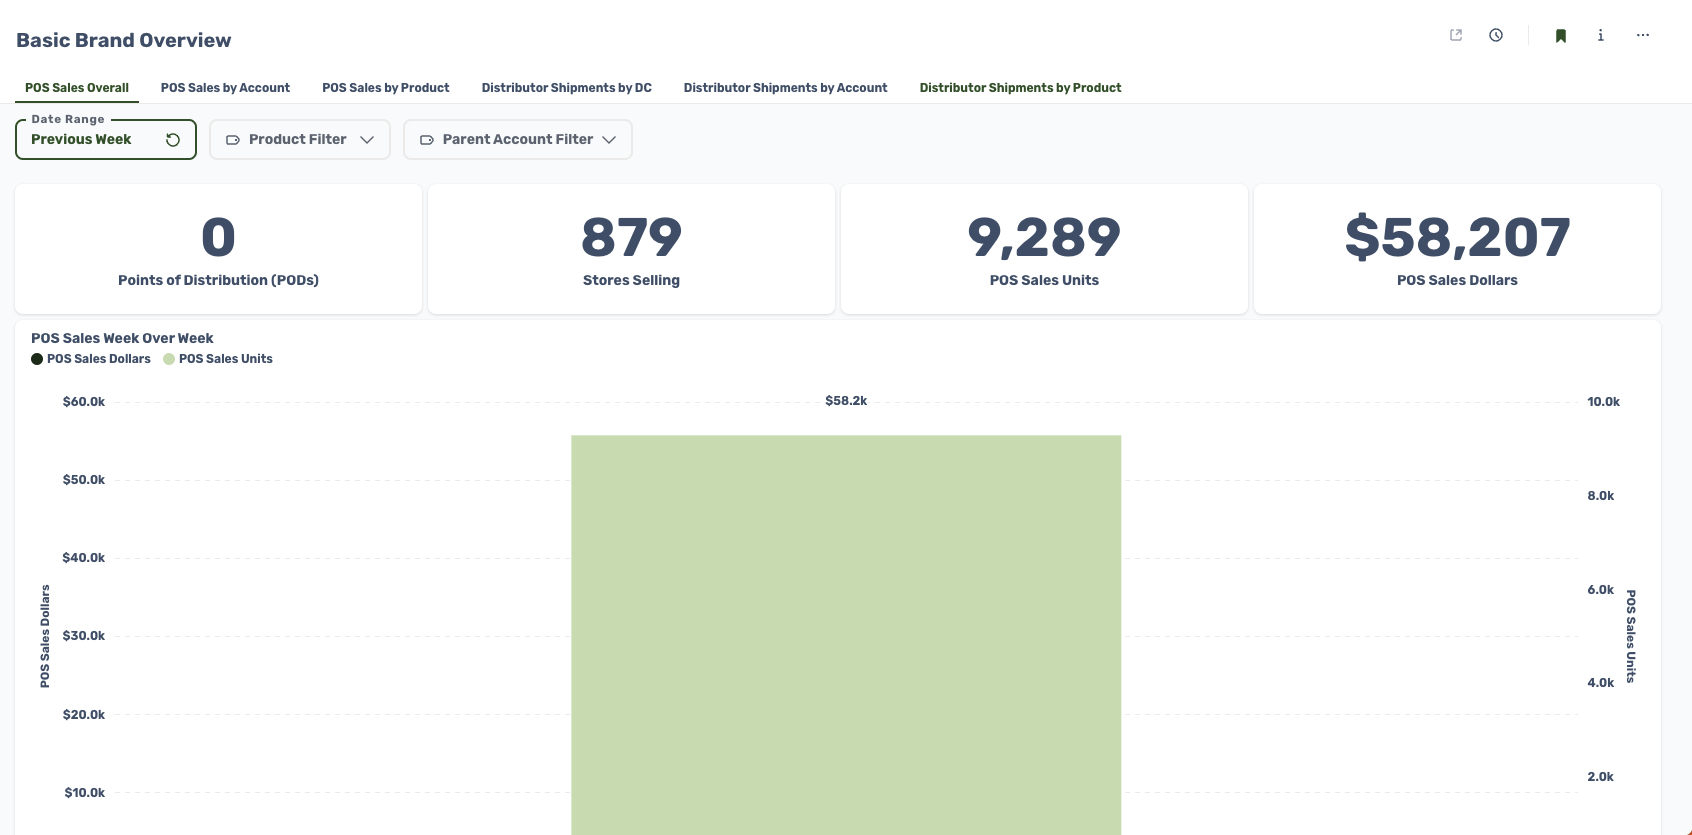
Muffin Data Dashboard</p></figcaption></figure>

3. Double check the numbers in the R-Wholesale tabs in the SmartModel™

<figure><img src="https://2089194542-files.gitbook.io/~/files/v0/b/gitbook-x-prod.appspot.com/o/spaces%2FuPhWdKX288WBK7UyaQZw%2Fuploads%2FY9l3j2KKcLCTxI2ZX9oV%2Fimage.png?alt=media&#x26;token=5ae72ce4-3f3a-41eb-b16f-f47c6c81c48a" alt=""><figcaption><p>R-Wholesale by PRA / Product / PRA Product</p></figcaption></figure>
